From environmental signals to supply chain decisions

Turn climate, production, and supply chain data into forward-looking intelligence.

Picterra Insights Hub helps organizations monitor sourcing regions, anticipate production risk, and strengthen supply chain resilience using geospatial AI.

Picterra Insights hub logo

A new layer of supply chain intelligence

Climate and environmental risks are now operational risks. But most supply chain decisions still rely on fragmented signals and delayed reporting.

Picterra Insights Hub connects environmental, production, and supply chain intelligence into a continuous monitoring layer. Teams gain early visibility into risk, variability, and emerging disruption across sourcing regions.

Four intelligence layers.
One operational view.

Picterra Insights Hub connects four intelligence pillars to turn environmental signals into operational decisions.

Supply Chain Compliance & ESG

Sourcing & Production Intelligence

Environmental Intelligence

Traceability & Mapping

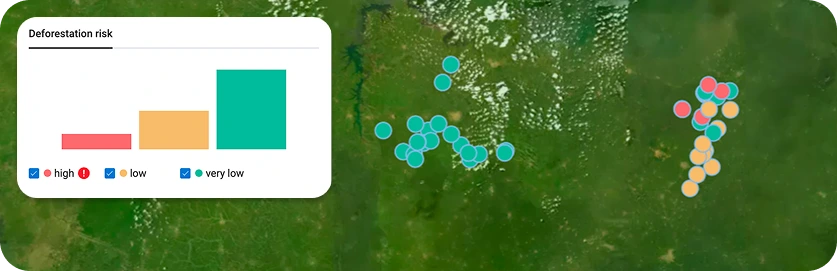
Screenshot-style visualization showing a satellite map background with clusters of colored dots representing deforestation risk levels across different locations. In the top-left corner, a small chart labeled “Deforestation risk” displays three bars for high (red), low (orange), and very low (green) risk categories. On the map, groups of dots are color-coded to match the legend, with one cluster mostly green (very low risk) and another cluster containing a mix of orange and red points indicating higher risk areas.

Stay ahead of compliance and ESG risk

New regulations and ESG commitments are reshaping global supply chains. Organizations must move from periodic reporting to continuous monitoring.

Picterra Insights Hub provides ongoing visibility into compliance risk across sourcing regions, helping teams identify exposure early and support audit-ready verification.

Capabilities
  • EUDR
  • NDPE
  • SBTI — Flag Scope 3
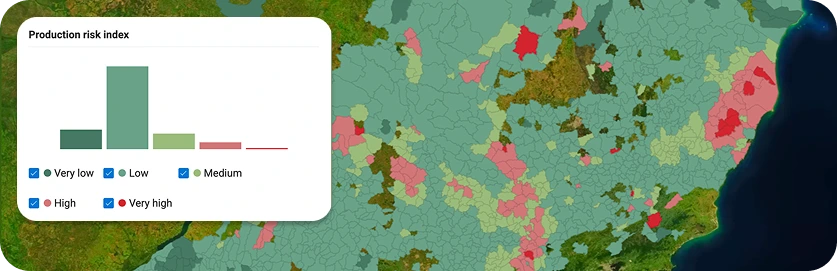
Map-based visualization of a “Production risk index” over a regional landscape divided into many small administrative or geographic units, each shaded in different colors to indicate risk levels. A legend in the top-left shows categories ranging from very low and low (greens) to medium (light green), high (pink), and very high (red). The map highlights a patchwork of mostly low-risk areas with scattered zones of higher risk in pink and red, suggesting localized production challenges across the region.

Anticipate production risk before it impacts supply

Production risk builds gradually across the season. Weather anomalies, crop stress, and environmental pressure can shape outcomes months before harvest.

Picterra Insights Hub detects these signals early, helping teams anticipate variability and adjust sourcing strategies before disruption occurs.

Capabilities
  • Yield variability index
  • Crop health
  • Production forecast
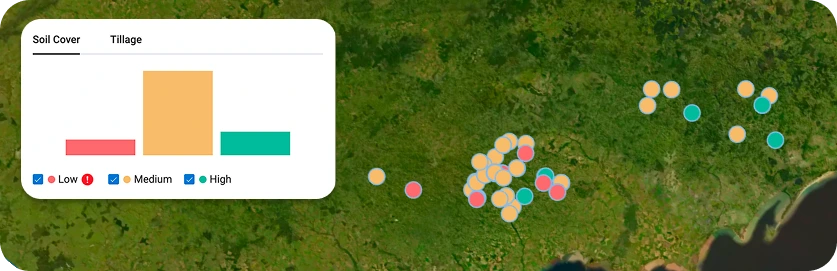
Satellite map visualization showing clusters of colored dots representing soil management indicators across a landscape. A panel in the top-left labeled “Soil Cover” and “Tillage” includes a bar chart with categories for low (red), medium (orange), and high (green). On the map, grouped points are color-coded to match these categories, with a dense cluster of mostly medium and some low values in one area, and smaller clusters with a mix of medium and high values elsewhere, indicating varying soil cover or tillage practices across locations.

Understand environmental risk across sourcing regions

Environmental conditions directly influence supply reliability. Picterra Insights Hub monitors climate and ecosystem signals to detect emerging risks and resilience patterns.

This allows teams to move from reactive responses to proactive planning.

Capabilities
  • Practice integrity index
  • Crop cover
  • Biodiversity risk
  • Irrigation management
  • Regenerative agriculture monitoring
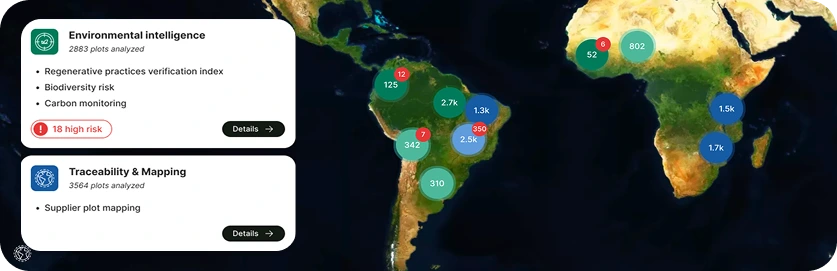
The dashboard shows a world map focused on South America and Africa with clustered data points. On the left, it summarizes environmental intelligence (2,883 plots analyzed, including regenerative practices, biodiversity risk, and carbon monitoring, with 18 high-risk cases) and traceability & mapping (3,564 plots analyzed, focusing on supplier plot mapping), each with a “Details” option for more information.

Build supply chain visibility from region to plot

Traceability connects environmental signals to sourcing decisions. Picterra Insights Hub maps supplier networks and production areas to create actionable visibility.

This enables teams to move from regional risk detection to supplier-level action.

Capabilities
  • Supplier geolocation
  • Crop identification

Explore public GeoAI insights

Picterra Insights Hub also powers public intelligence, helping organizations understand emerging risks across key sourcing regions.

Featured Insight


Brazil’s 2026 coffee crop looks strong. Does the data agree?

Brazil is heading toward a record harvest, but environmental signals suggest a more complex picture. Explore how production risk varies across regions.

From signals to decisions

Picterra Insights Hub connects compliance, production, environmental, and traceability intelligence into a single operational view.

Turn environmental signals into supply chain decisions.