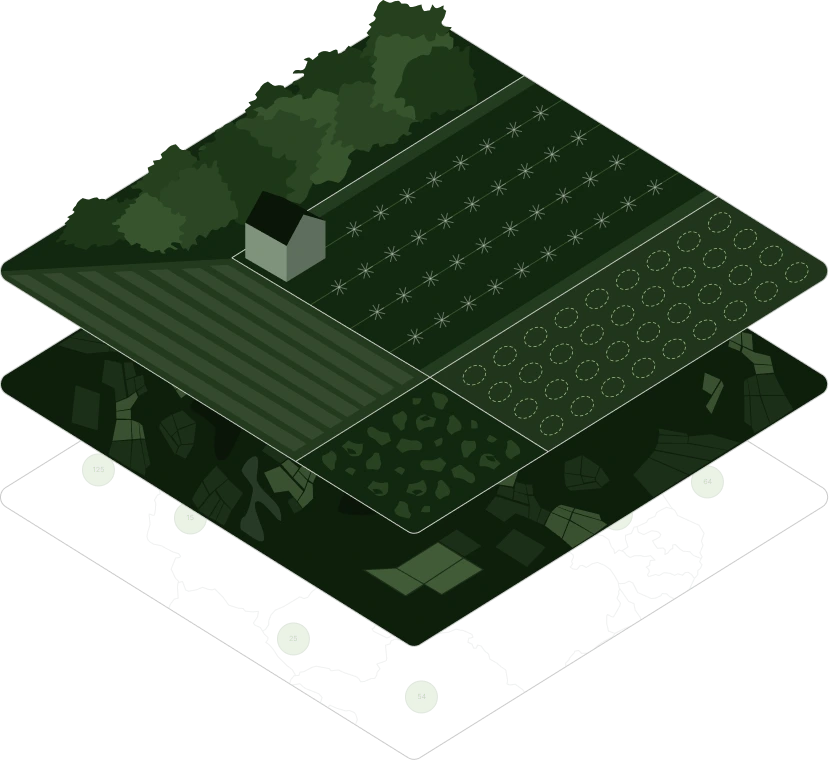
Picterra has spent ten years building the architecture that turns satellite imagery, curated partner datasets, weather and climate data, and supplier information into plot-level intelligence across every farm, field, and forest in the global supply base. The technology behind Insights Hub is what makes commodity intelligence possible.


Commodity supply chains don’t fail because there isn’t enough satellite data. Sentinel-2 provides 10- to 20-meter imagery with a five-day revisit. Planet’s PlanetScope constellation captures near-daily 3-meter imagery. The raw cadence exists.
They fail because most tools give visibility without coverage. Data without discovery. Analysis without consistency. Insight without integration into the workflows where sourcing decisions actually happen. The gap is less a tool gap than a structural mismatch between the problem and the architectures being applied to it.
Continuously understanding what exists on the ground, across vast geographies, under changing conditions, with incomplete information: that is the technology challenge Picterra is built to solve.
Many systems provide visibility, analysis,
but not coverage.consistency.
Many systems provide data,
but not discovery.actionable information.
Many systems provide insight,
but not integration into workflows
that prompt business-critical action.
Managing uncertainty at supply-base scale isn’t about a single model or a bigger dataset. It takes architecture. These are the six cornerstones we’ve built into every layer of the Picterra stack, each addressing a specific gap in most existing tooling.
How it's built: Tracer orchestrates the continuous observation and change-detection workflows.


How it's built: Forge builds the GeoAI models that answer the specific questions no off-the-shelf dataset can.
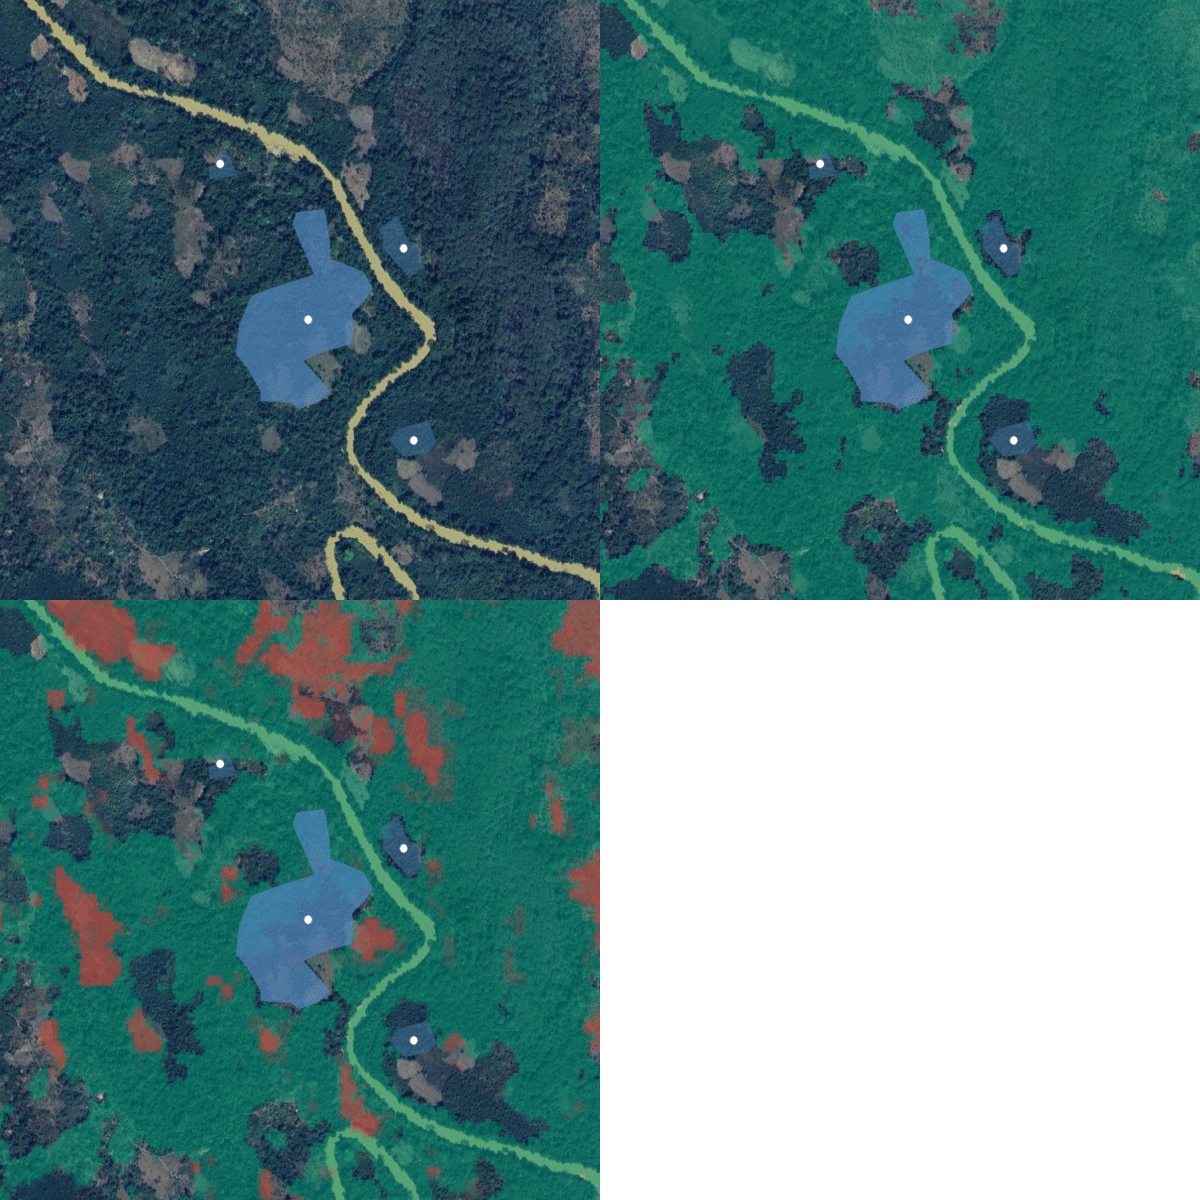

How it's built: Forge models adapt to local context. Tracer workflows enforce consistent outputs across regions.


How it's built: Tracer joins detections with reference layers, weather, climate, and supplier data into a single reasoning surface.


How it's built: Insights Hub is the surface where the plot-to-portfolio hierarchy becomes navigable.


How it's built: Insights Hub, with an agentic reasoning layer that surfaces what matters on a continuous cadence and every claim traceable to source.

Three layers, built to work together. Forge creates the models. Tracer orchestrates the workflows. Insights Hub packages the intelligence for the teams that use it.
Build and continuously improve GeoAI models that detect the phenomena relevant to specific sourcing questions. Agroforestry practices. Riparian buffers. Farm renovation. Crop condition. Land-use change. Deforestation. What each customer’s supply chain actually needs to see, not what a generic land-cover product happens to publish.
Primary role: creating the right data for the specific question.
Combine detections, temporal signals, environmental context, and reference layers into repeatable GeoAI workflows. Take a tree-loss detection from Forge, join it to historical land-cover data and the plot’s location in a protected area, and produce a defensible deforestation risk classification. Repeat that logic across every plot in a supply base, on a continuous cadence.
Primary role: combining the right datasets and detections into decision-grade workflows.
Surface the resulting intelligence for sourcing, procurement, and sustainability teams. Insights Hub is where the plot-to-portfolio hierarchy becomes navigable, where the agentic reasoning layer surfaces what matters, and where every claim is traceable back to source. The place commodity intelligence gets packaged and put to work.
Primary role: surfacing and packaging insight where sourcing decisions actually get made.
From custom detector prototypes to optimized workflows and enterprise integrations, our geospatial and AI experts help your team turn imagery into impact.
A common technology stack solves very different sourcing problems. Four examples of how the components combine.



Weather anomaly + satellite crop condition + phenology stage → plot-level production risk forecast.



Historical forest cover + change detection + plot boundaries + reference layers, including Google’s Global Forest Typology → plot-level deforestation risk classification, aligned with EUDR requirements.


Land-use change + biomass estimation + historical observations → carbon emissions and removals intelligence at Land Management Unit level.


GeoAI detections + time-series analysis + supplier data → practice verification and persistence tracking across a supplier base.