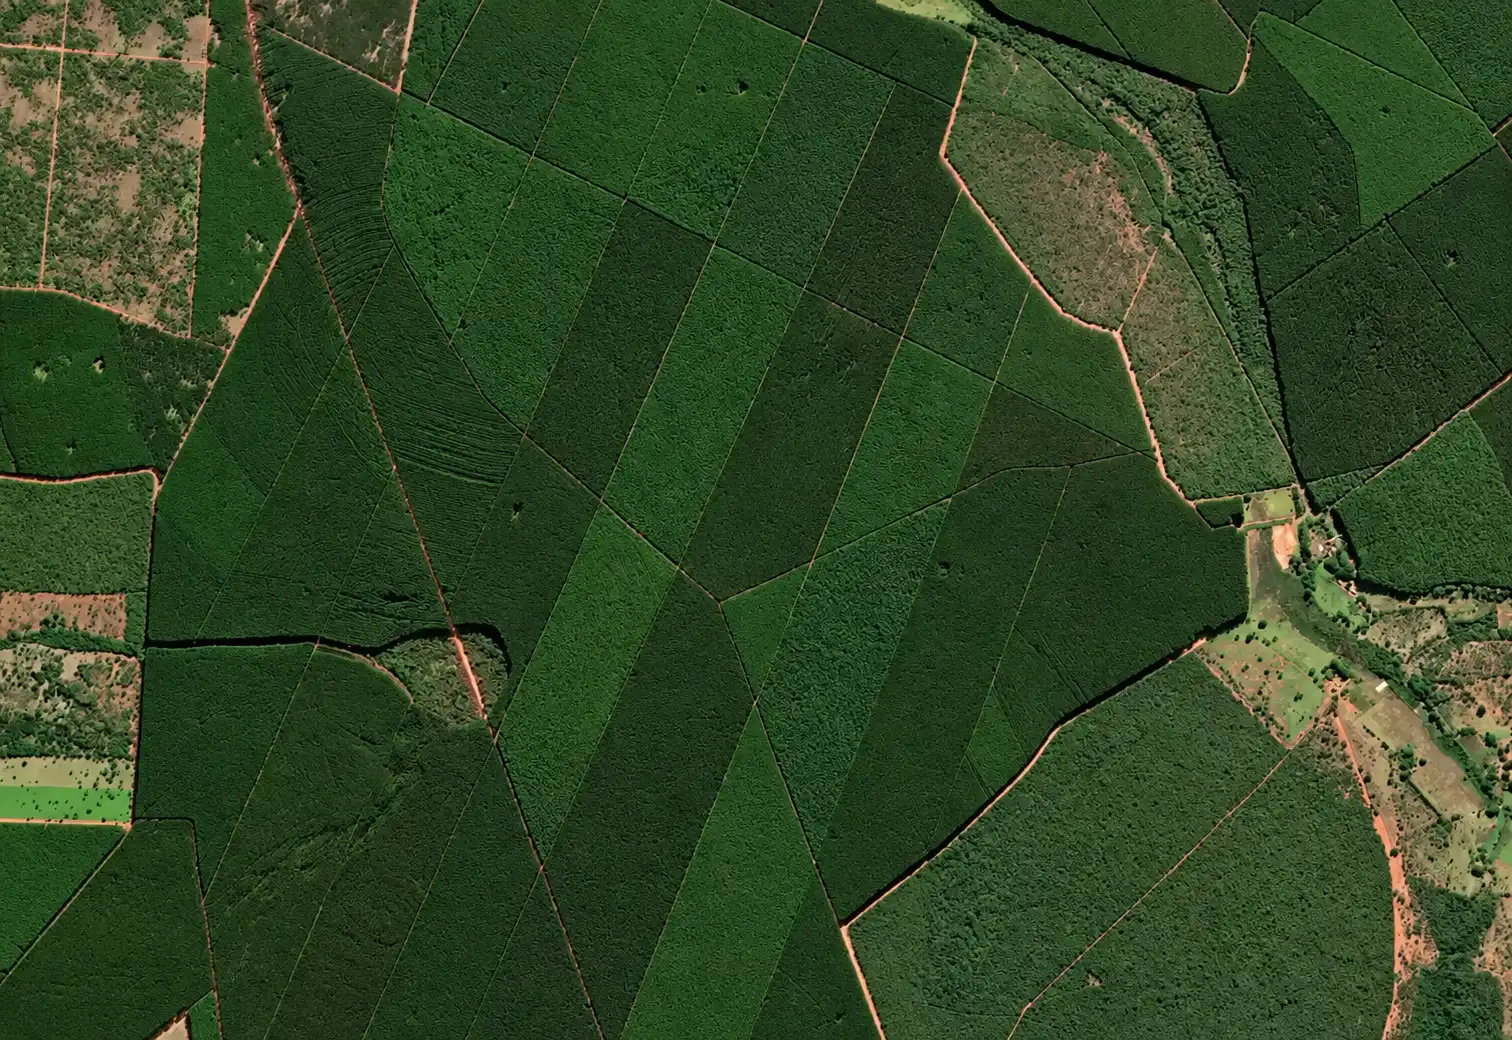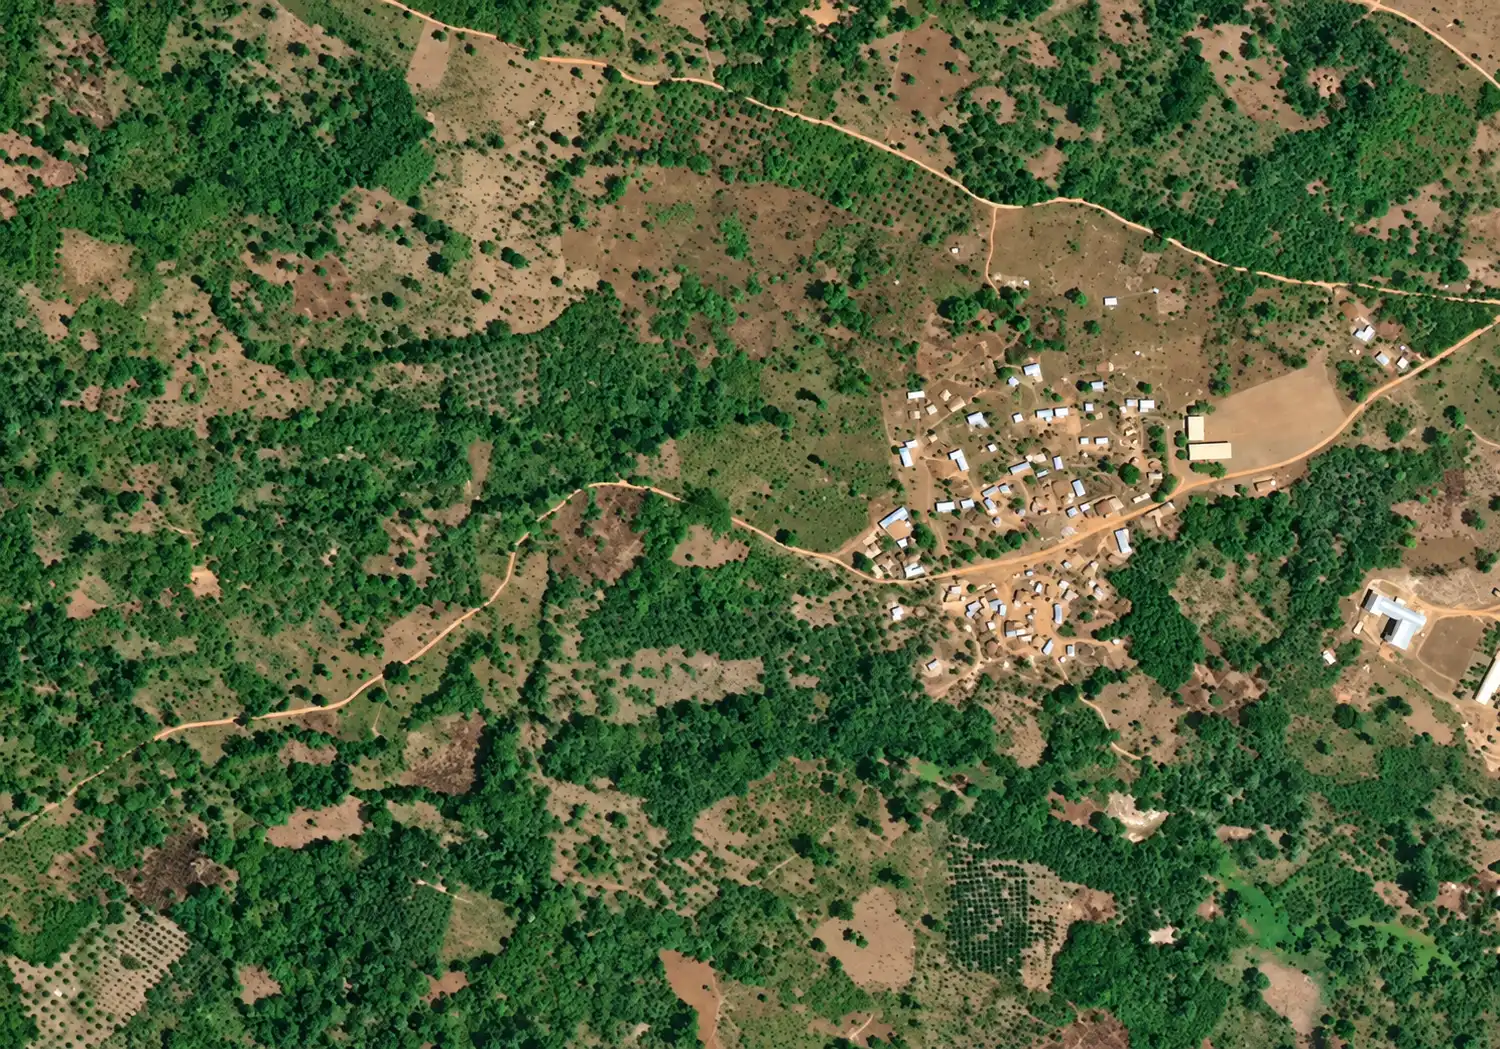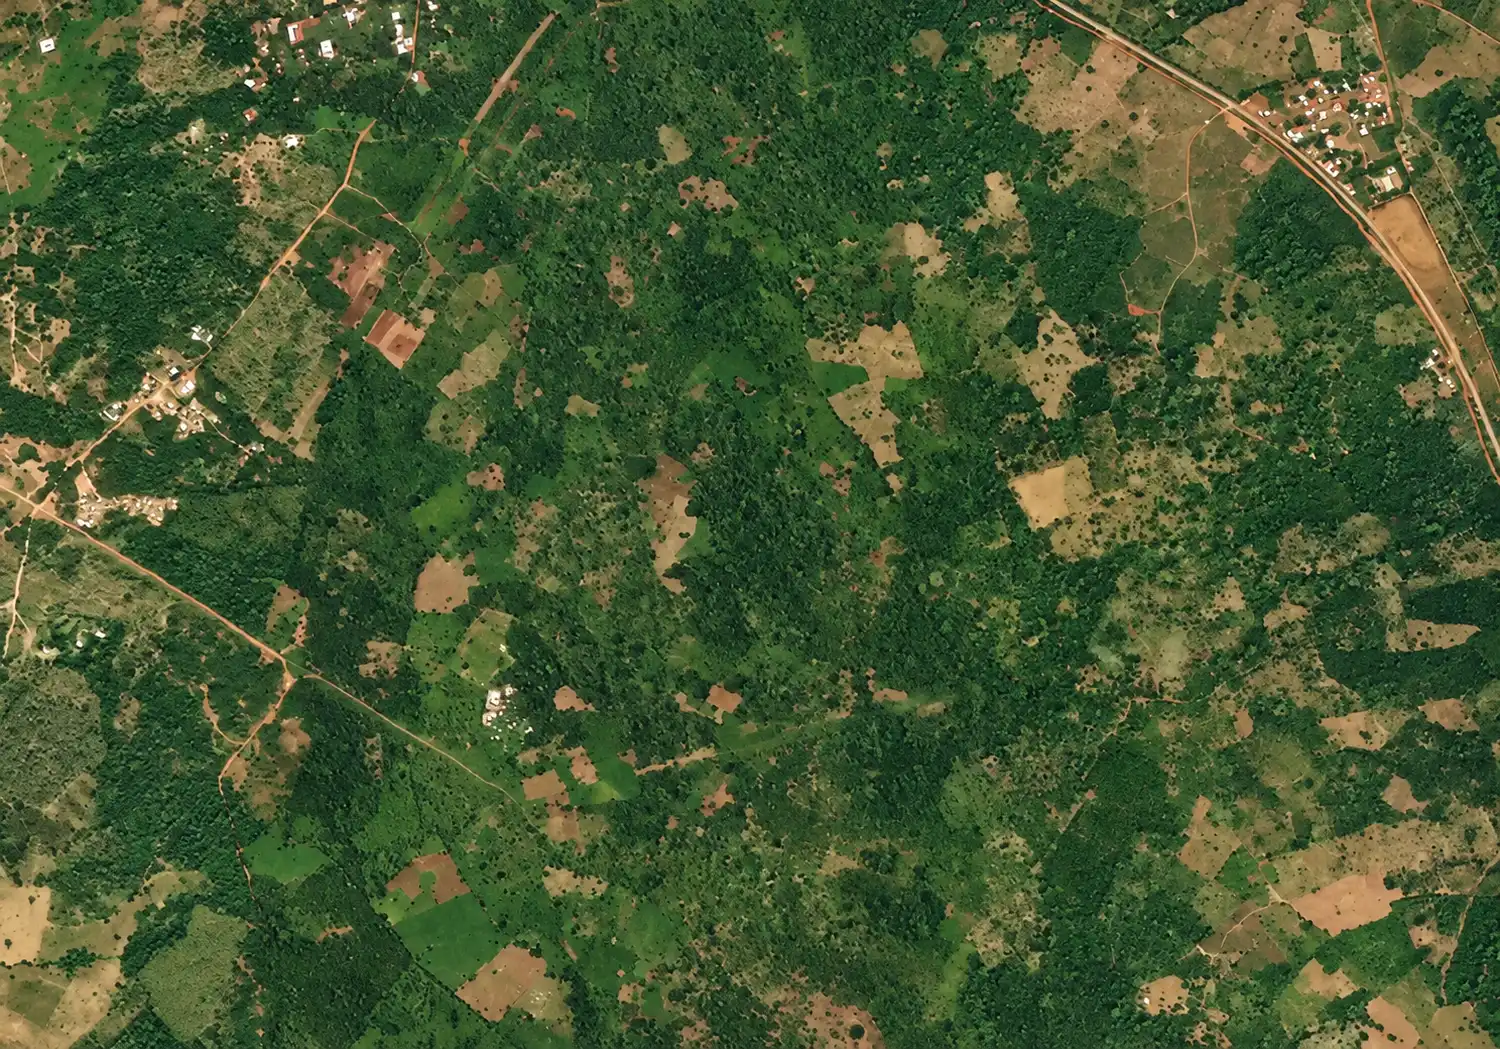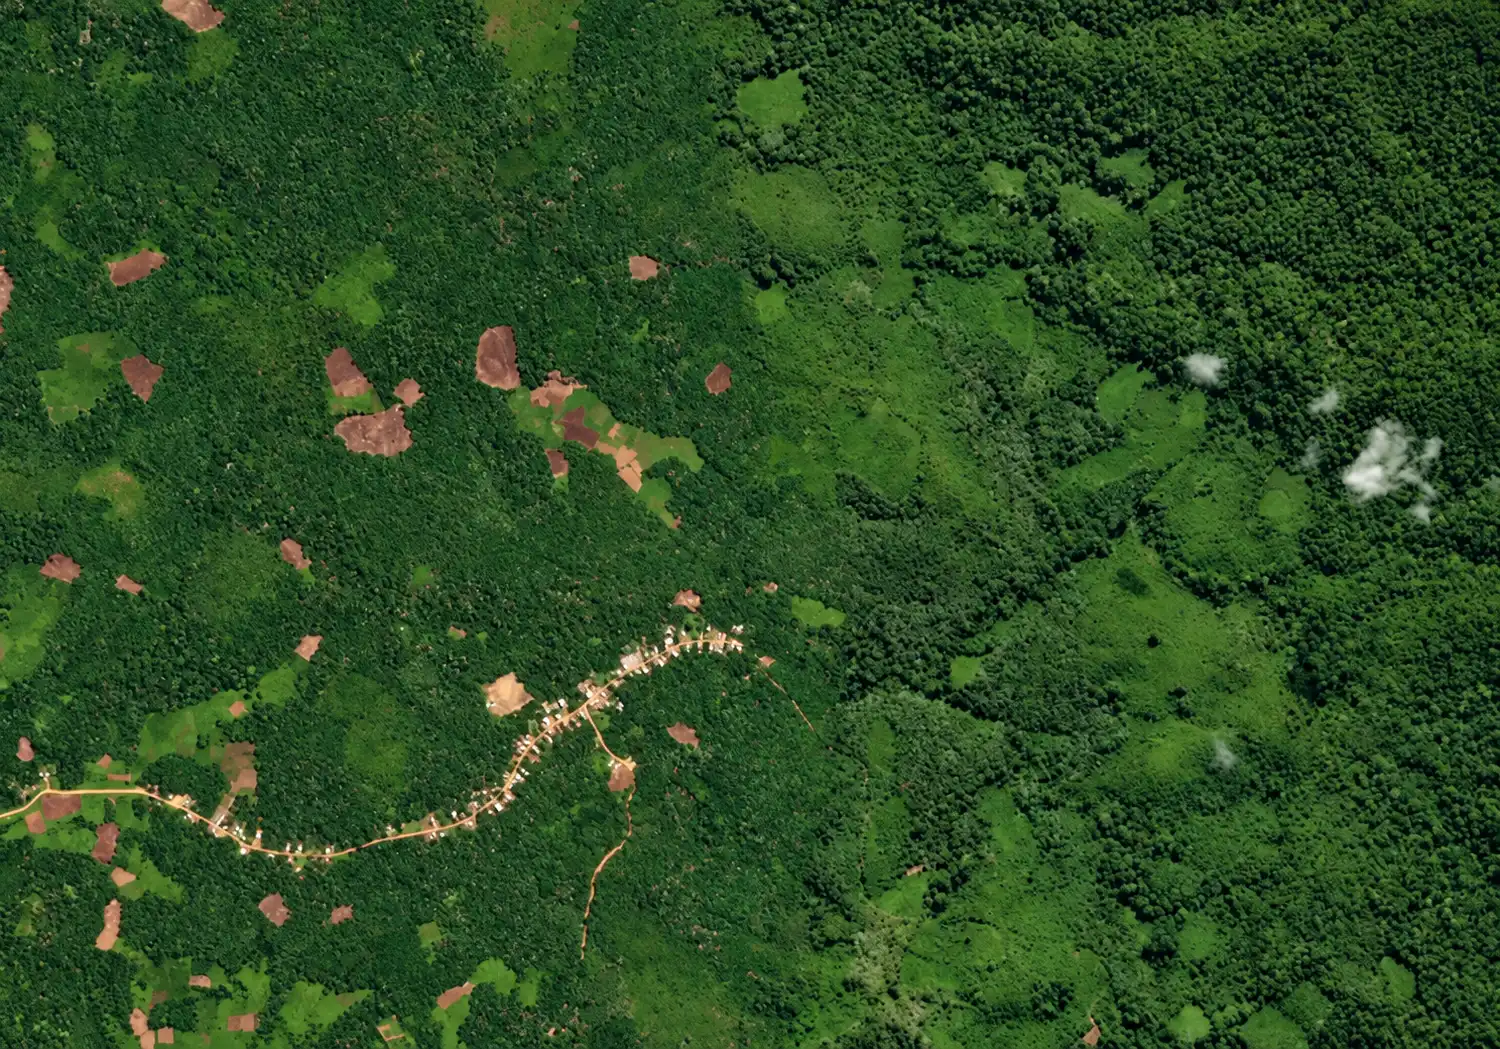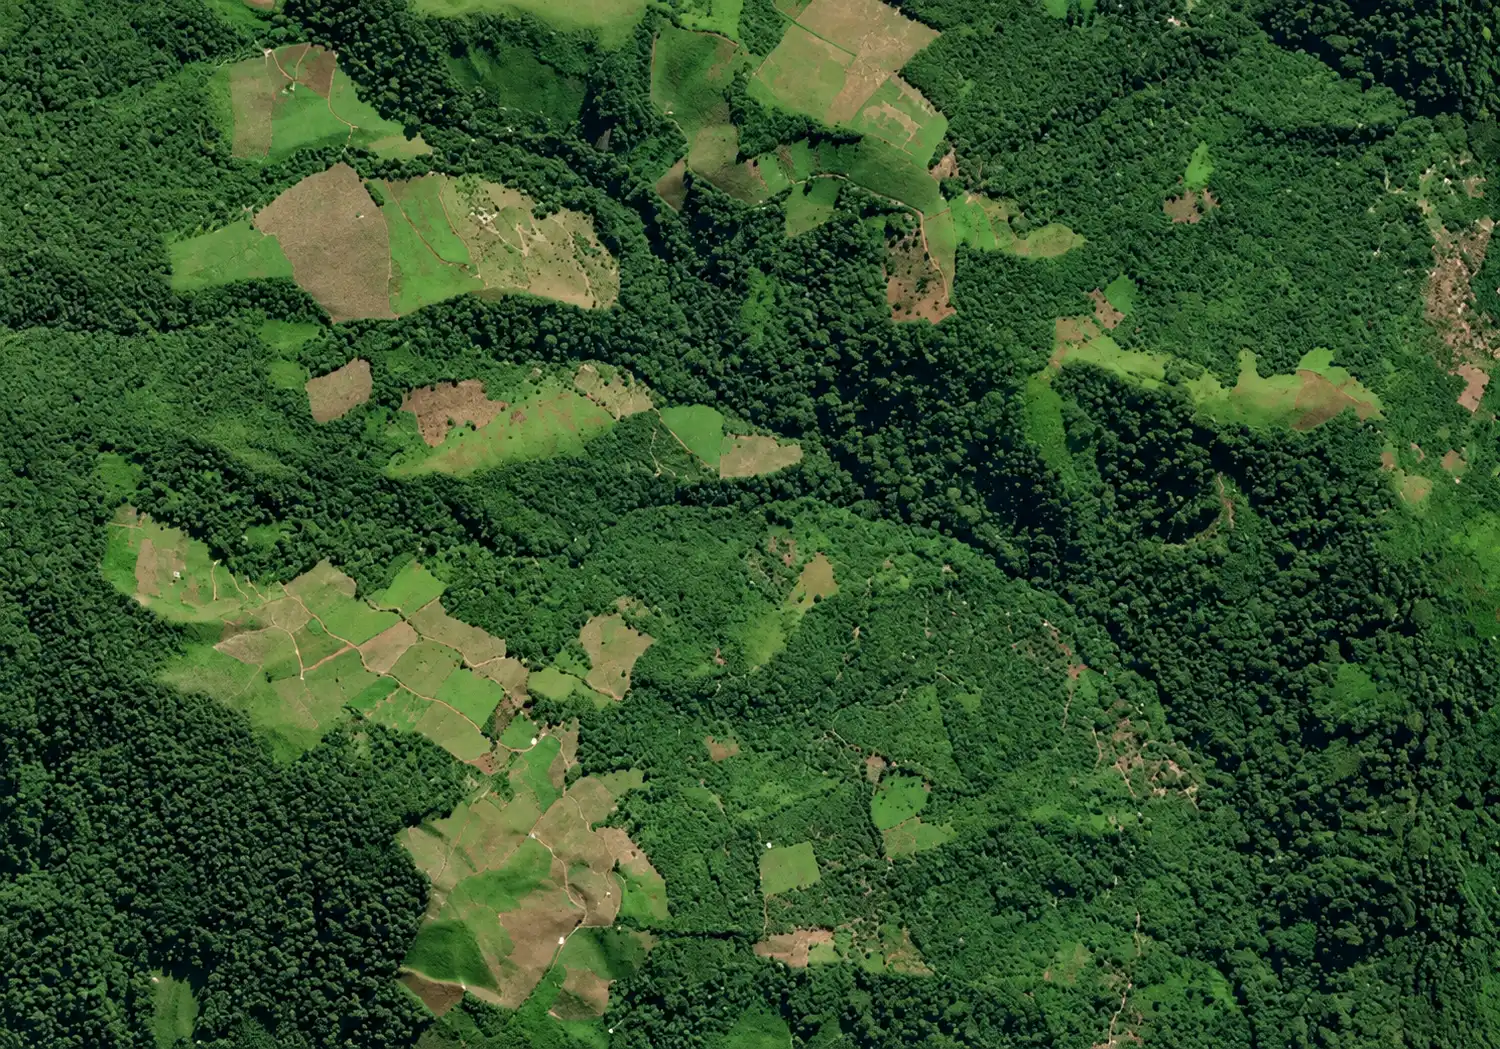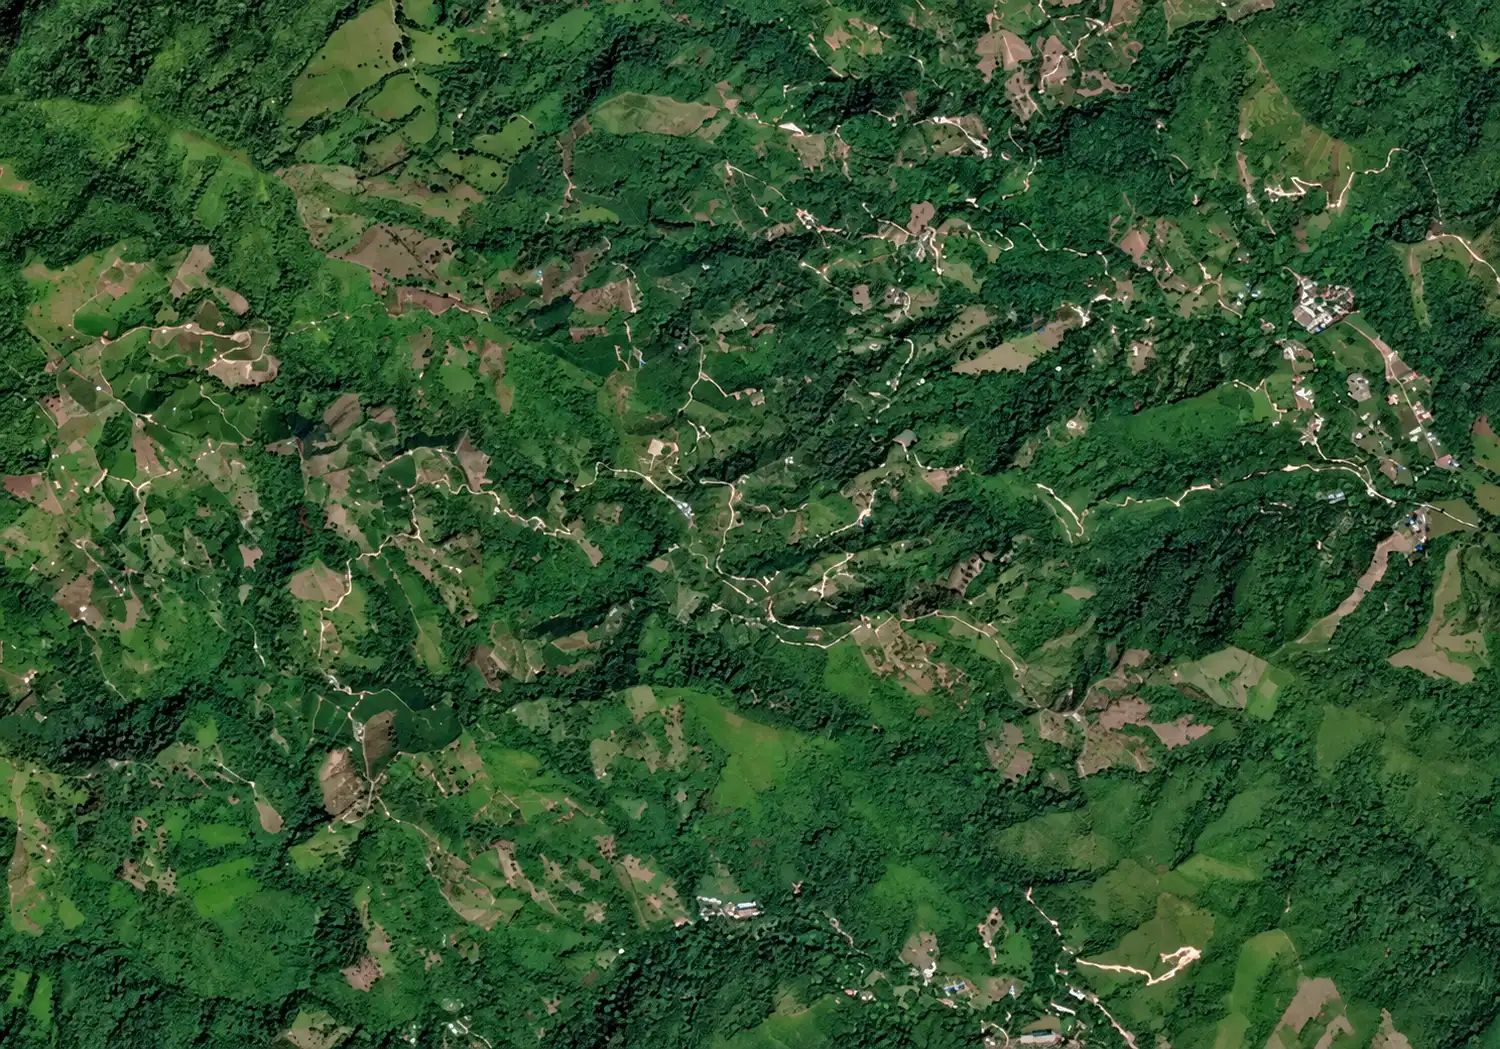
Find any agricultural area on Earth. Lens analyzes it in seconds, bringing resilience, climate, carbon, and compliance signals together into one connected picture.
Free. No account needed.
Erosion risk, fire and flood history, land cover, and irrigation. What the land has been through, and what it is exposed to.
A fifteen-day outlook and projections to the 2040s. How conditions are shifting at this specific location, not across the region.
Land conversion emissions and how much of the area has changed over time. The carbon history written into the land itself.
Forest cover at the 2020 baseline, change since, and proximity to protected areas. The signals that attract scrutiny.
Search for a location by name, or spin and zoom the globe until you find somewhere worth looking at.
Zoom in and Lens draws an analysis frame around the area. One tap to run it. Nothing to upload, nothing to draw.
Four dimensions with a plain-language summary of each. Download the full report, or send the analysis to a colleague.

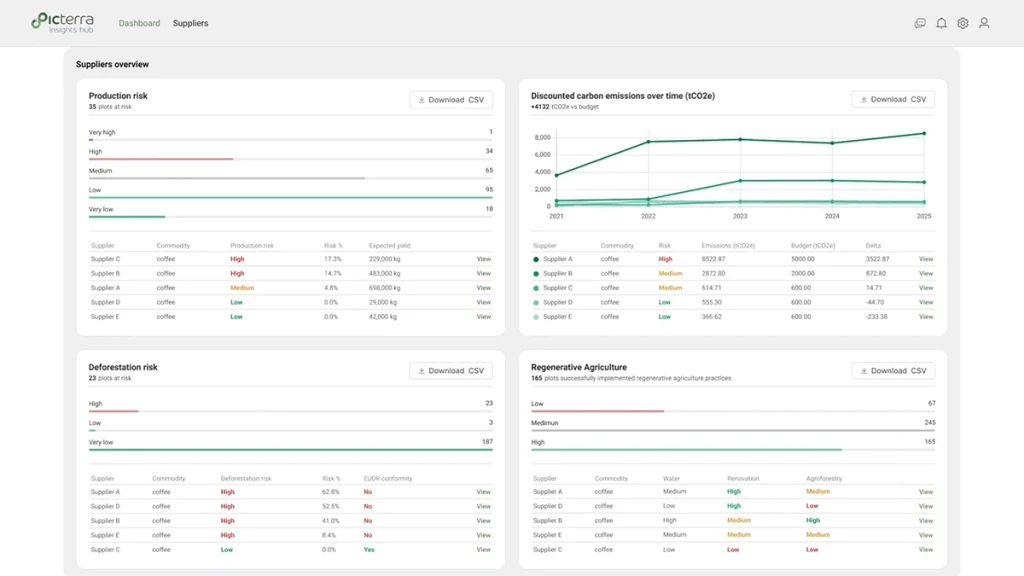
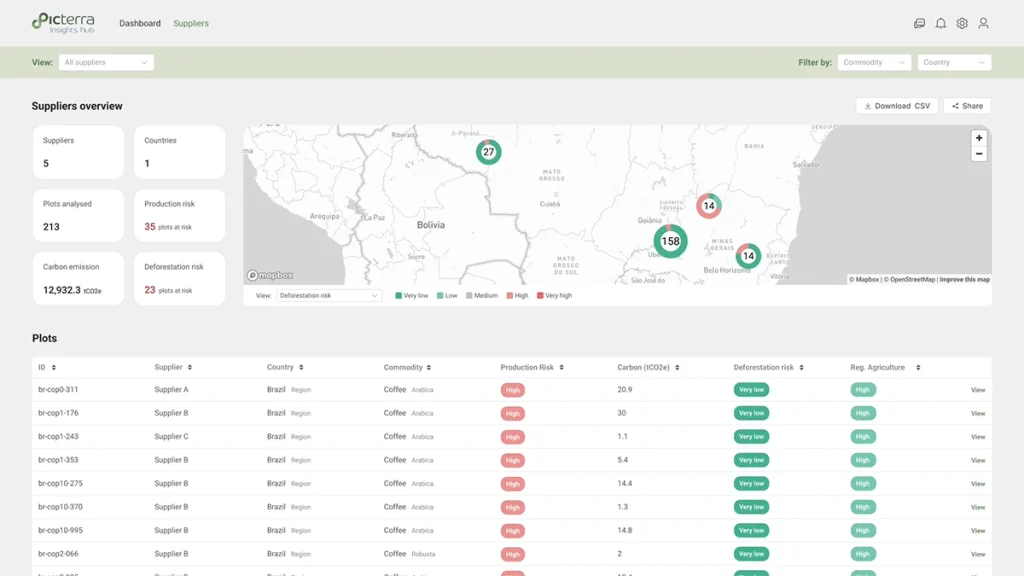
Picterra Lens and Insights Hub are built on the same GeoAI technology. What Lens shows you is what that technology can see without knowing anything about your supply chain.
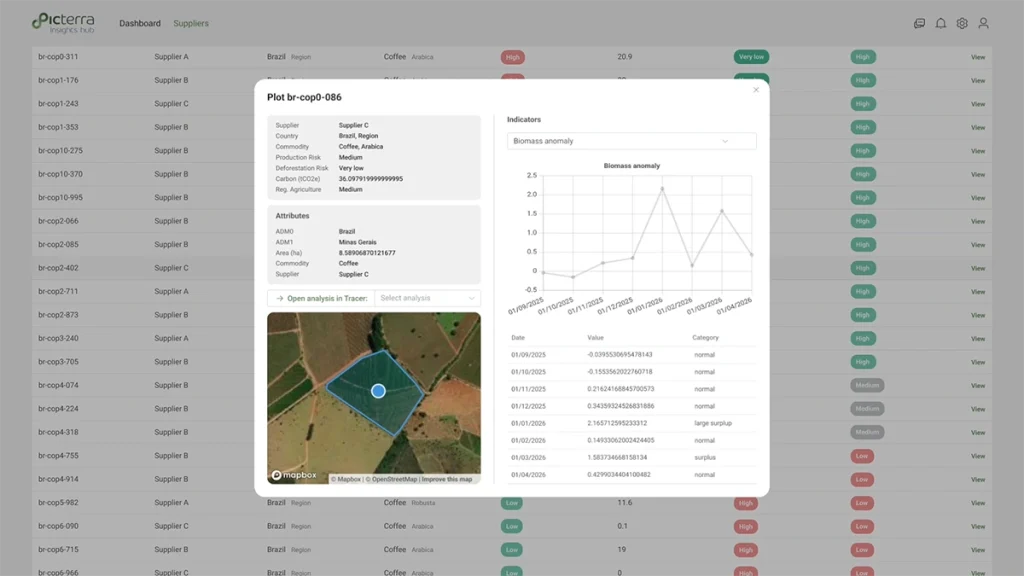
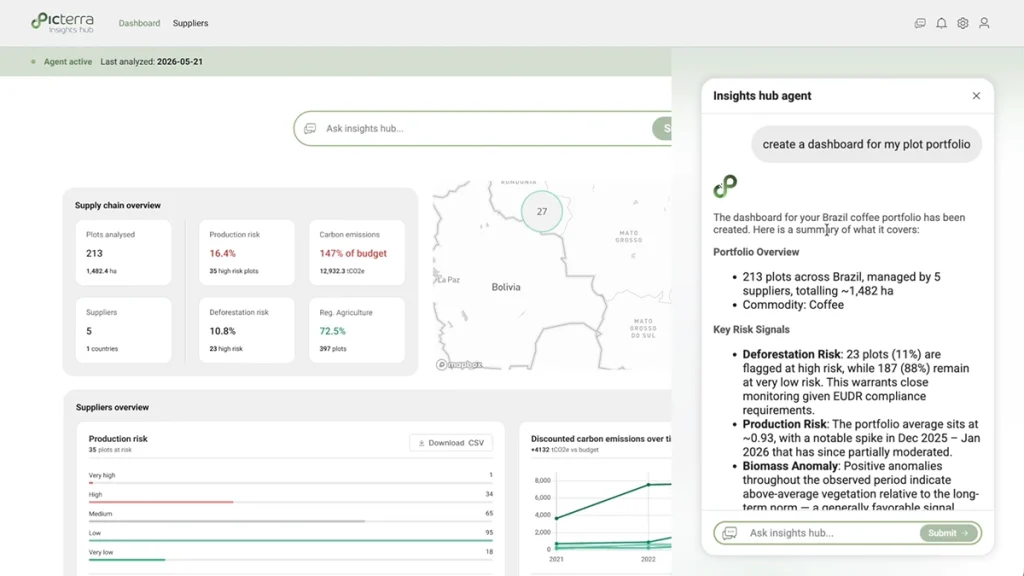
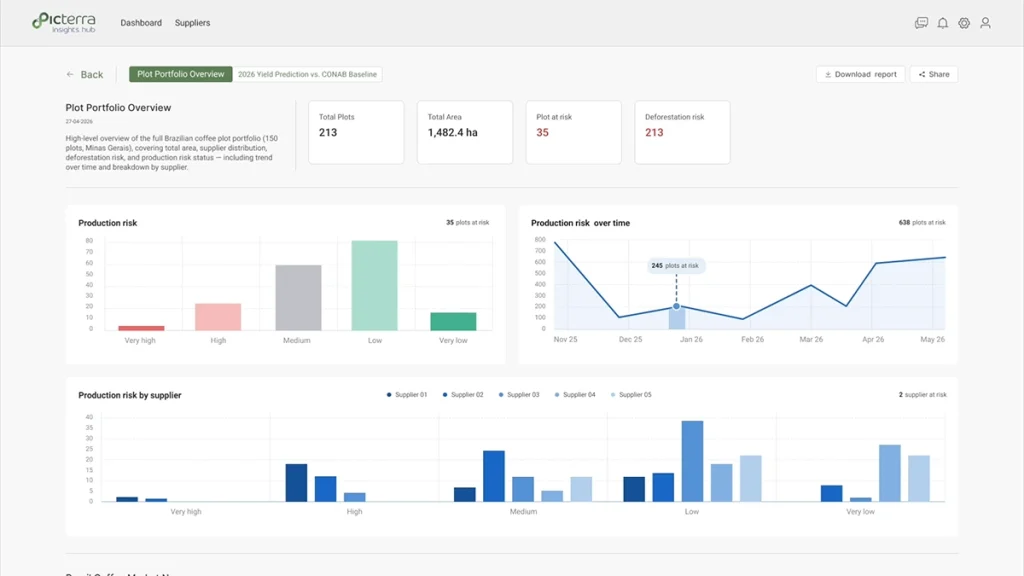
Insights Hub goes considerably further. It monitors an entire supply base continuously rather than one area once, and adds production risk forecasting, supplier data verification, carbon and deforestation reporting structured for frameworks such as SBTi FLAG, and an agentic layer that surfaces what matters across thousands of plots rather than leaving you to search for it. The fields marked “Available in Insights Hub” in your results are a partial list of what sits behind it.
If a single area tells you something useful, the question worth asking is what the same intelligence would show across every plot you source from.
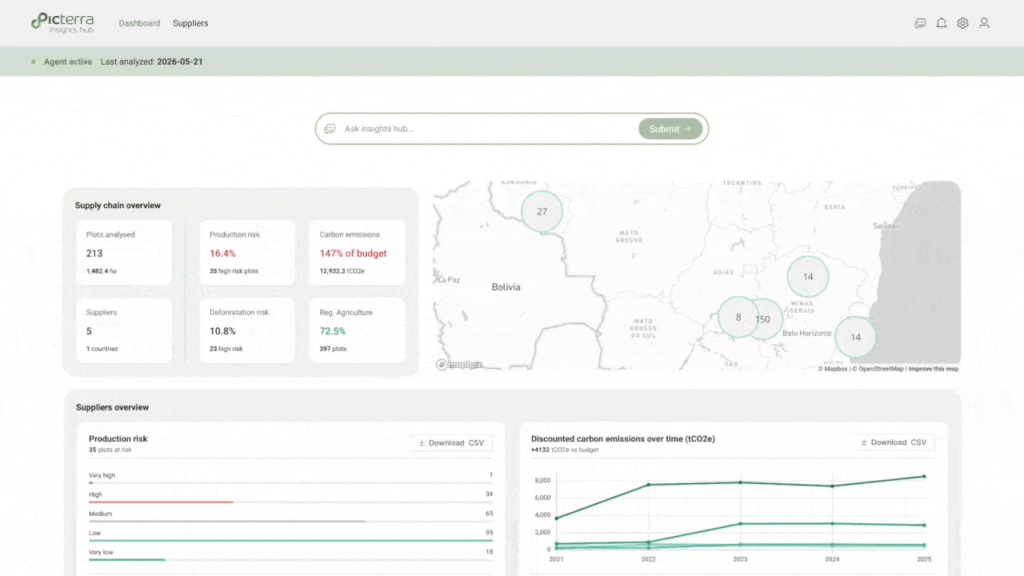
Twenty years of fire history, land conversion emissions, erosion exposure, and forest change since 2020. Detail a country-level view never shows.
Picterra Lens is a free online analysis that shows environmental and land-use signals for agricultural areas worldwide. Find a location, zoom in, and Lens returns resilience, climate, carbon, and compliance indicators for that area, drawn from satellite observation and environmental datasets. It runs in a browser on desktop or mobile, with no account or installation required.
Yes. Running an analysis is free and requires no account. Downloading the full PDF report requires an email address.
Search for a location by name, or spin and zoom the globe. Once you zoom in close enough, Lens draws an analysis frame around the area, and an Analyze button appears. If you zoom in too far, the frame disappears, since the area becomes too small to analyze meaningfully. Zoom back out slightly, and it returns.
Lens analyzes the area inside the frame shown on screen, typically a few hundred hectares depending on zoom. It does not detect individual field or farm boundaries, so the frame may include several land uses. Figures in the report refer to the framed area, not to any legal parcel or land holding.
Lens combines satellite imagery with public and licensed environmental datasets covering forest cover, land cover, fire history, surface water, soil, erosion, terrain, cropping intensity, and weather. The full source list is available in the app via the information icon and accompanies every report.
Lens is deliberately general. It analyzes any location on Earth without knowing what grows there, using global datasets at the resolution available everywhere, within a frame set by zoom rather than a field boundary. That is what lets it work anywhere, and it means the figures describe the area in frame rather than any specific farm or parcel inside it.
An Insights Hub deployment removes those constraints. Analysis runs on supplier geolocation that has passed more than thirty quality checks, uses models tuned to the specific crop and geography, draws on higher-resolution imagery where it matters, and is validated against field observation. Lens shows you what the technology can see. A deployment shows you what it can establish.
No. Lens is not a compliance tool, and its outputs are not suitable for European Union Deforestation Regulation due diligence, Due Diligence Statements, regulatory submissions, or certification. Forest cover and deforestation figures are indicative only. For compliance work, Picterra Insights Hub produces audit-ready evidence structured for regulatory reporting.
Lens analyzes one area, once, from global datasets, without knowing what grows there. It is free and asks nothing of you.
Insights Hub is a commodity intelligence platform. It runs on your own verified supplier geolocation, uses models tuned to your crops and geographies, monitors continuously rather than once, and adds production risk forecasting, carbon and deforestation reporting structured for frameworks such as SBTi FLAG, and an agentic layer that surfaces what matters across thousands of plots. The underlying GeoAI technology is shared. What it is pointed at, and what it is given to work with, is not.
Yes. Every analysis has its own permanent link. Share it directly to LinkedIn, by email, or by copying the URL. Anyone who opens the link sees the same analysis without needing an account.
No. Lens works entirely from what you select on the map. You don't need to upload files or draw boundaries.
Yes. Lens is built mobile-first and runs in a mobile browser without installation.