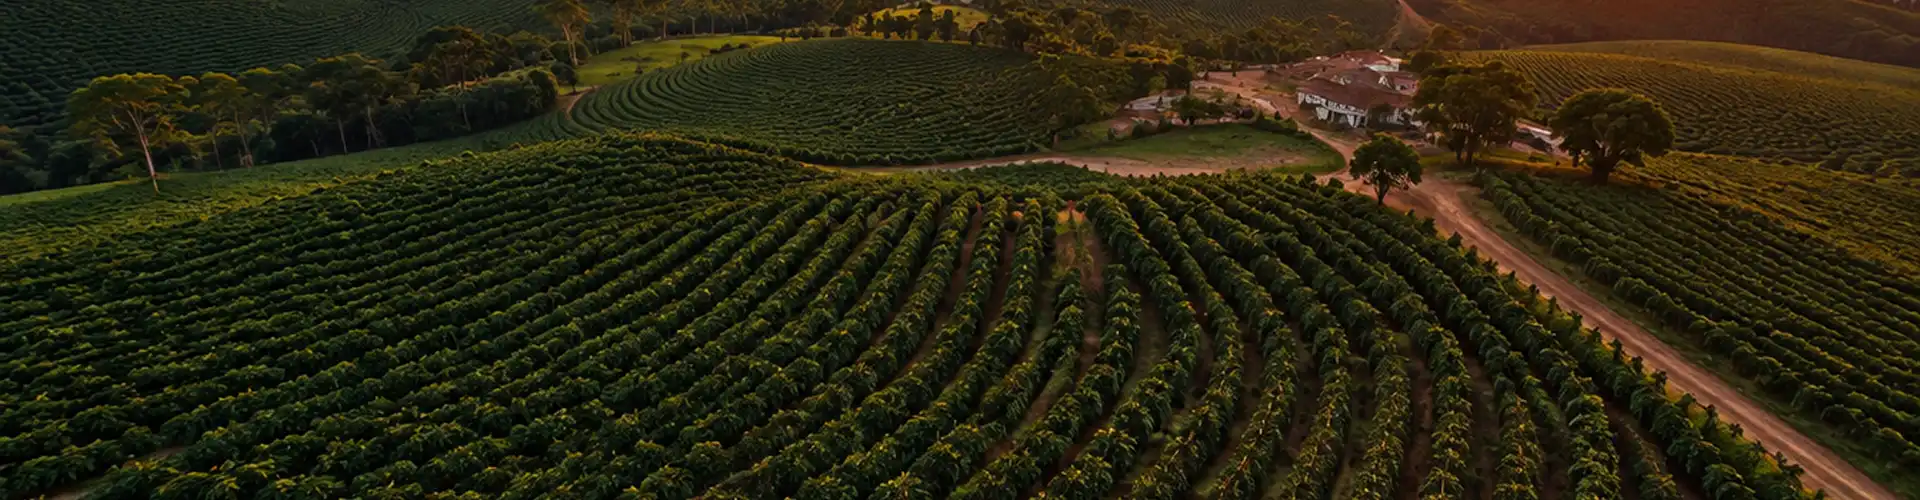
Aerial view of lush green coffee crops planted in neat, curving rows across rolling hills, illuminated by warm sunlight near a farmstead building.

Brazil grew a record coffee crop. Why was it such a hard year for the cup?

In March, we launched a public insight to test a headline. Brazil was heading for a record coffee harvest, and expectations were firmly set on abundance. Growers in São Paulo and southern Minas Gerais were describing something less comfortable: dry soils at fruit set, a hot December, and plants that had suffered.

With the harvest now in, both accounts proved right. CONAB’s September estimate puts the crop at 67.6 million bags, a record and 19.6% above 2025. CONAB credits the jump mainly to the positive year of Brazil’s biennial cycle, when arabica trees bear a heavier crop after a lighter one, along with new production areas and higher average yields. Over the same weeks, CEPEA warned that the 2026/27 arabica crop is likely to deliver one of its weakest quality results in recent years, with a high share of lower-grade coffee.

We followed that season with monthly updates to the insight, an interactive tool built with Insights Hub technology to demonstrate what the platform can do. Our Production Risk Index tracked how coffee in Sul de Minas, Alta Mogiana and the Cerrado Mineiro responded to rainfall, temperature and canopy signals, each measured against its long-term average. This is our final read: how a record crop became such a hard year for the cup, what the index caught, what we would change, and why the next season already deserves attention.

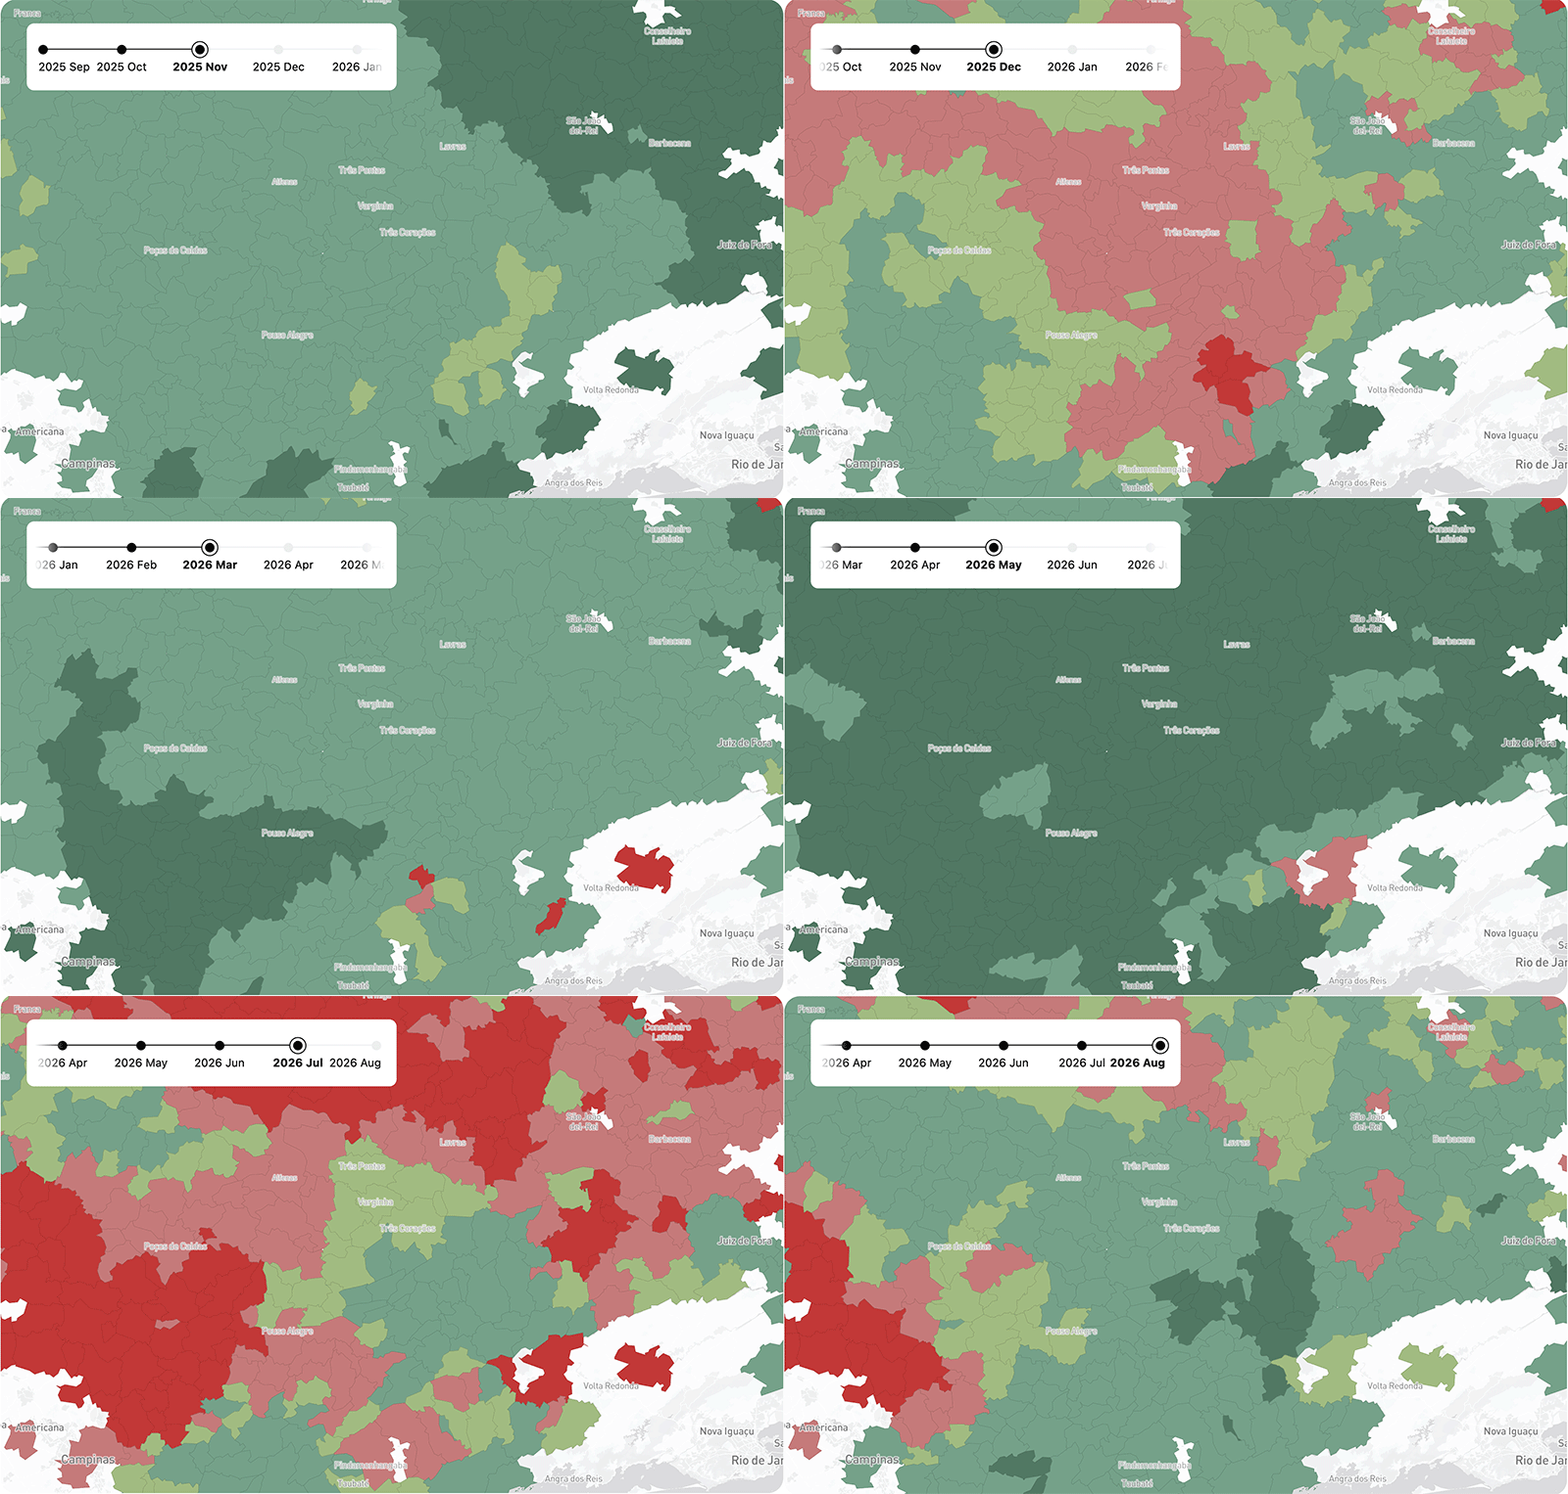
Map view showing regional areas in Brazil, with an interactive timeline bar overhead progressing from November 2025 to August 2026.

The season at a glance

The season split into two halves. Through May, the risk sat in the plant. From June, it moved off the tree and into the harvest itself.

Period

Risk reading

What drove it

October and November 2025

Caution

Rainfall deficit at fruit set, cushioned by cooler temperatures

December 2025

Very high

Heat of 30 to 32°C with rain still short, during fruit expansion

January and February

Recovering

Steadier rain and milder temperatures through grain filling; February was the wettest month in the series

March and April

Low, slowing

Cooler conditions slowed maturation and pushed harvest later in higher-altitude Sul de Minas

May

Low

A stable entry to harvest, with the first field reports of smaller beans

June

Very high

Persistent rain and cold during picking and drying

July

High

Rain in the driest month of the year, concentrated on the sweeping stage

August

Easing

Dry weather returned and the last of the crop came in

The first half wrote two things into the crop. December’s heat and drought capped how large the beans could grow, even as the canopy still looked healthy from space. Then a strong recovery through grain filling built the weight and volume behind the record.

The second half was about the bad weather at the wrong time. The trees stayed healthy. Persistent rain and cold arrived in June, just as picking began. In July, the cold eased, but rainfall stayed above normal in what should be the year’s driest month.

In several regions, most of July’s rain fell in the final days of the month, right on the varrição. This is the sweeping stage, when growers gather the coffee that has fallen to the bare ground. It is the most exposed part of any harvest, usually kept separate and sold as a lower grade, and wet ground lots are prone to mold and fermentation. By July 29, the national harvest stood at 78%, down from 90% a year earlier and the five-year average of around 85%, according to Safras & Mercado. CEPEA estimated that around 30% of the arabica crop was still in the field.

Dry weather finally returned in August, and the last of the crop came in. In the Cooxupé cooperative’s area, which spans southern and central Minas Gerais and São Paulo, the harvest reached 98.6% by September 18.

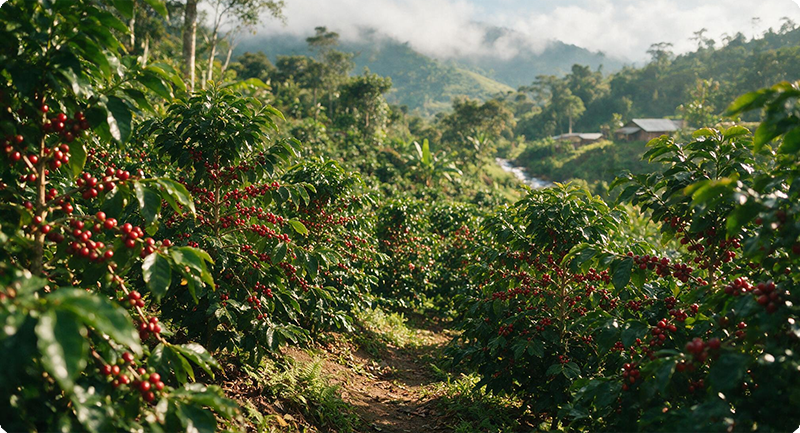
Close-up view of vibrant coffee plants heavy with ripe red coffee cherries along a dirt path in a lush, mountainous hillside farm.

How a record crop and a hard cup year are the same crop

Volume, bean size, and cup quality usually move together, so they’re often read as one signal. This season they came apart, and each one traces back to a different stage.

Measure

Outcome

Where it was decided

Volume

Record

January and February grain filling, plus the positive year of the biennial cycle and new planted area

Bean size

Smaller than expected

December heat and drought during fruit expansion

Cup quality

Weaker than usual

June and July rain during picking, sweeping and drying

Good rain early in the year, while the beans were filling, supported heavy yields on top of the positive biennial year. But the December heat stress the index flagged had already limited how far the beans could grow, and field reports from May onward described smaller screen sizes. Then the winter rains hit quality at the stage where it is protected or lost: the weeks between the tree and the drying patio.

The result is a record crop with a larger-than-usual share of lower-grade coffee and wide variation in quality and bean size from lot to lot. A single national number cannot show any of that. It averages the strong lots and the rain-damaged ones into the same figure.

Tracking production risk stage by stage also gives an early read on quality, because the timing of stress shapes the bean:

Stress

Crop stage

Likely effect on the bean

Water stress

Bean expansion

Small or empty beans

Heat stress

Bean filling and maturation

Lower density, with less sugar and acid development

Irregular flowering

Flowering

Uneven ripening, which complicates harvest timing

Rain

Harvest and drying

Over-fermentation, mold and physical defects


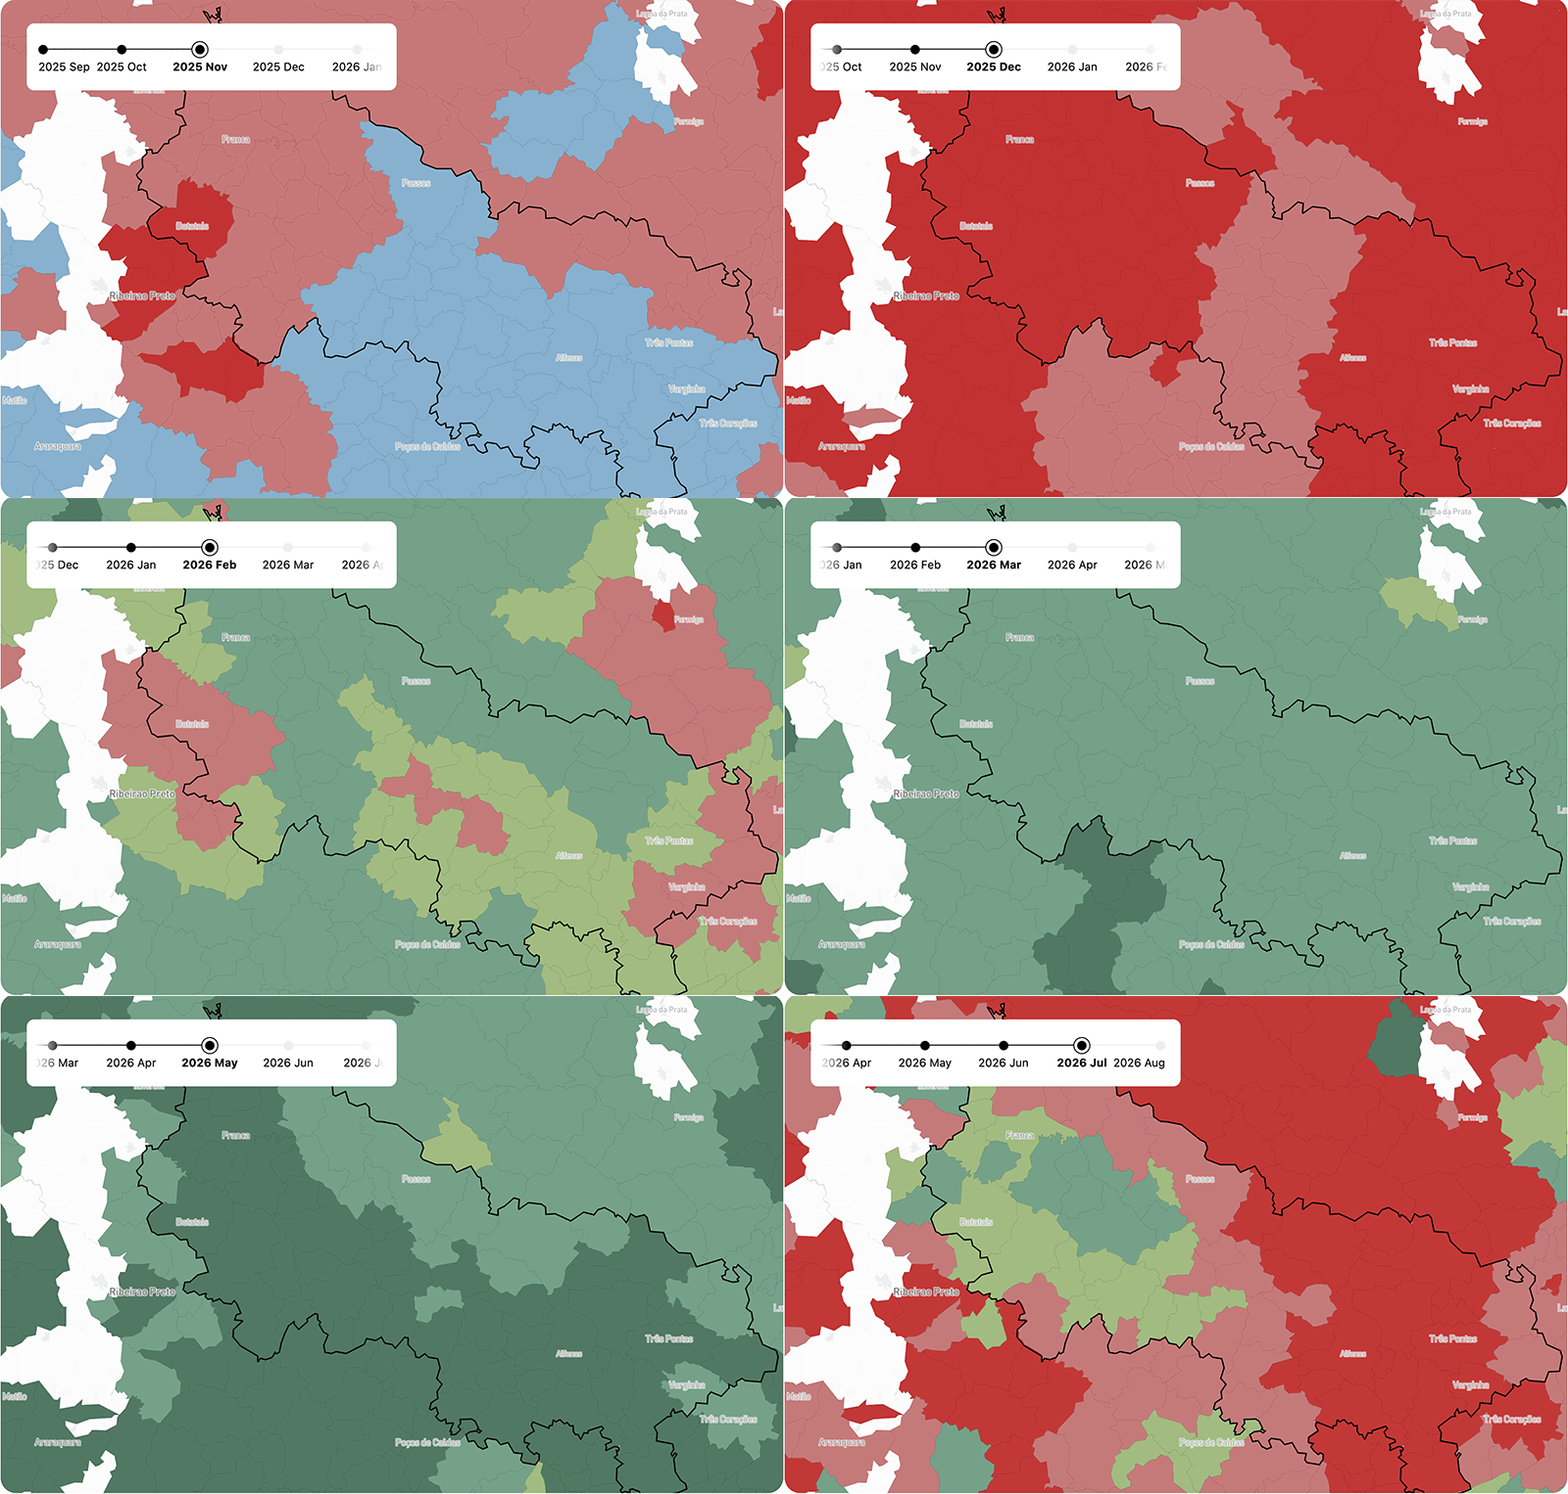
Map view showing regional areas in Brazil color-coded in shades of red and blue, with an interactive timeline bar overhead progressing from November 2025 to July 2026.

What the index got right, and what we would change

The central thesis of our first article held: a record national harvest and uneven, embedded production risk could both be true. Three signals stand out.

  • December. The index registered heat stress while the canopy still looked green from space. The smaller beans reported at harvest match that signal.
  • June. The index rose sharply as rain and cold arrived at the start of picking, while vegetation stayed close to normal. It pointed to the harvest, not the tree, as the new source of risk. EMATER and CEPEA reported delays and quality concerns in the same weeks, and in early July arabica futures recorded their largest single-day increase this century.
  • July. The index stayed high across the core arabica belt and low in Espírito Santo and eastern Minas, matching the regional split in harvest timing and exposure.

We also read one part of the season too hopefully. Good rain from January to March, followed by a cool, slow maturation, looked set to let the beans mature well and lift quality, and in April and May we saw that too. Two things then pulled quality down: uneven ripening from irregular flowering, which complicated harvest timing, and heavy rain at harvest, which raised the risk of over-fermentation. The index flagged the harvest risk as it built in June, but it cannot confirm the outcome. That still happens after harvest, when beans are classified for premium lots: visual assessment for shape and defects, screen grading for size, and cupping for flavor. The index gives an early read on where quality is at risk, and grading confirms it.

If we run this analysis again, four changes are at the top of our list:

  1. Stage-aware vegetation scoring. Today the index treats a canopy running well above its long-term norm as a risk signal. That is why August still shows red in the tool, although a greener canopy after harvest is a healthy sign of a plant storing energy for its next flowering.
  2. Phenology and altitude. Altitude drove harvest timing this year, and timing decided how much coffee was exposed to the June and July rain. Aligning the index to each region’s crop stage would sharpen it.
  3. Humidity and soil moisture. Drying risk depends on more than rainfall and temperature. Adding these signals would improve the post-harvest read.
  4. Wider coverage. Regions on a different harvest calendar, such as Espírito Santo, told a different story this year and deserve their own read.

What it means for sourcing teams

The 2026 crop is now moving into the export pipeline, and the record headline describes quantity, not quality. Two lots from the same region, even the same farm, can sit far apart this year depending on when they were picked and what the weather was doing as they dried.

For teams buying from this crop, that points to a few practical steps:

  • Set commitments on intake data: density, moisture, defect count, and the cup.
  • Scrutinize late-harvest and swept ground lots hardest, since they took the brunt of the July rain.
  • Expect wide quality dispersion within regions, and avoid treating a regional average as a guide to any single lot.

The broader lesson goes beyond this harvest.

Production risk did not appear at harvest time. It built up stage by stage from October onward, and much of it was invisible in national forecasts and standard vegetation indices. By the time it shows up in production data, the window to plan around it has closed. That is the gap plot-level intelligence is built to close: replacing country-level approximations with a continuous read of how the crop in each sourcing region is responding to the season.

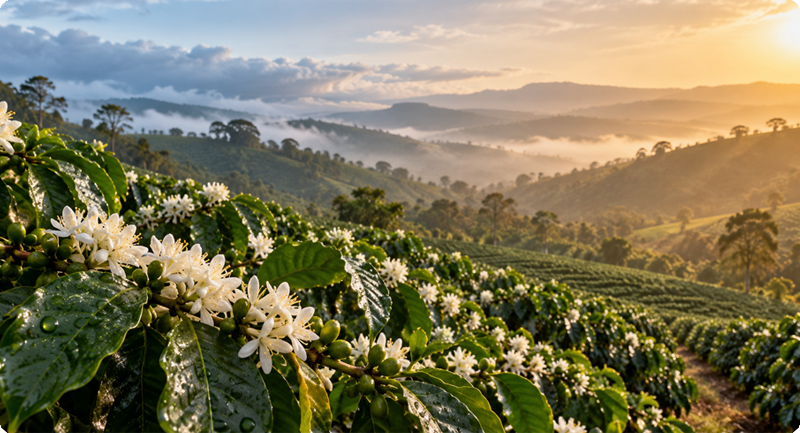
Close-up view of coffee plants in full bloom with delicate white flowers, set against a misty mountain valley bathed in golden sunrise light.

The next season is already under way

With this crop in, the 2027/28 season has started, and its first critical stage is happening now. September rains have favored flowering across most of the regions CEPEA monitors, and attention is turning to flower set, the stage that determines how many flowers become fruit. In some areas, rain from July onward triggered flowering earlier than usual, which raises the risk of uneven fruit formation and maturation later in the season.

Two further factors make this cycle harder to read. 2027/28 falls in the negative year of Brazil’s biennial cycle, so lower output is already expected. A Super El Niño is also building. The World Meteorological Organization expects it to raise the likelihood of above-normal temperatures across much of the world and to shift rainfall patterns, and in August NOAA put the chance of a very strong event through the northern autumn and winter of 2026/27 at more than 90%. El Niño events typically peak between November and February, placing Brazil’s flowering and early fruit formation in the middle of this period. CEPEA has flagged high temperatures and dry spells as the main threats to flower set.

Past events suggest the impact will not be uniform. Dr Aaron Davis, Senior Research Leader of Crops and Global Change at the Royal Botanic Gardens, Kew, told Global Coffee Report that El Niño’s effects are highly localized, varying within regions and countries as well as between them, and that drought is likely to be the main issue this time. That matches what this season showed in Brazil: a national outlook can hold while risk concentrates in specific places and stages. El Niño does not decide the outcome on its own, but it raises the odds that the kind of stress this season showed can be written into a crop months before harvest.

The full 2026 season remains accessible as an interactive tool in our Resources section. To learn how Insights Hub can monitor production risk across your sourcing regions, get in touch.

This season, the volume was never really in question. Quality was decided stage by stage, and the final stages mattered most.

About this insight

From October 2025 to August 2026, we tracked Brazil’s main arabica regions (Sul de Minas, Alta Mogiana and the Cerrado Mineiro) using satellite vegetation vigor, rainfall and temperature, each benchmarked against its long-term average and combined into a single Production Risk Index. The index is not a yield forecast. It is a structured read of how the crop responds to climatic pressure over time. We built the tool with Insights Hub technology to demonstrate the platform’s capabilities. The 2026 season view is now complete and remains accessible from our Resources section.

Related articles