
Picterra’s Insights Hub delivers plot-level weather, seasonal outlooks, and long-range climate projections, connected to the suppliers and volumes they actually affect. Configured to your origins in three to six weeks.
Picterra provides climate and weather intelligence across multiple time horizons, then goes further by combining forecasts with observed conditions, plot-level context, and supply-chain data.
Now
Weather and climate conditions, crop development, production risk
Daily field decisions
Next
Weather forecasts, seasonal outlooks, production and supply risk
Transplanting and land preparation timing
Future
Climate projections, crop suitability, future sourcing regions
Preparedness for extreme seasons
Picterra monitors a broad range of weather, agricultural, and climate indicators, translating them into crop-relevant risk signals across multiple forecasting horizons.
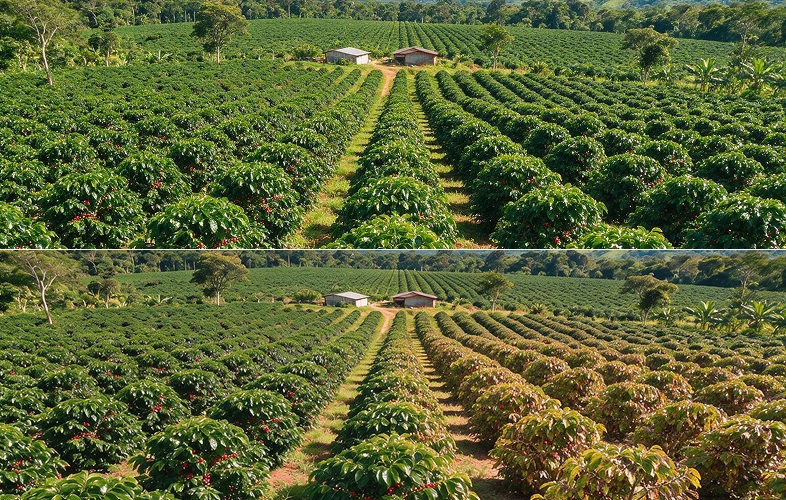

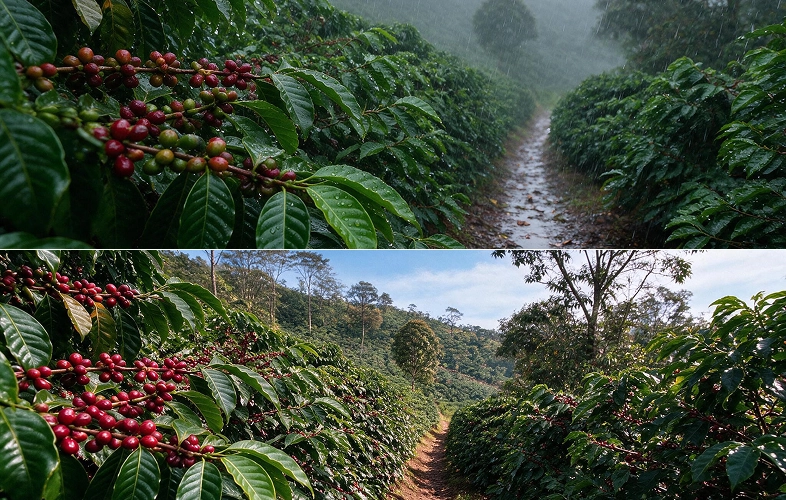

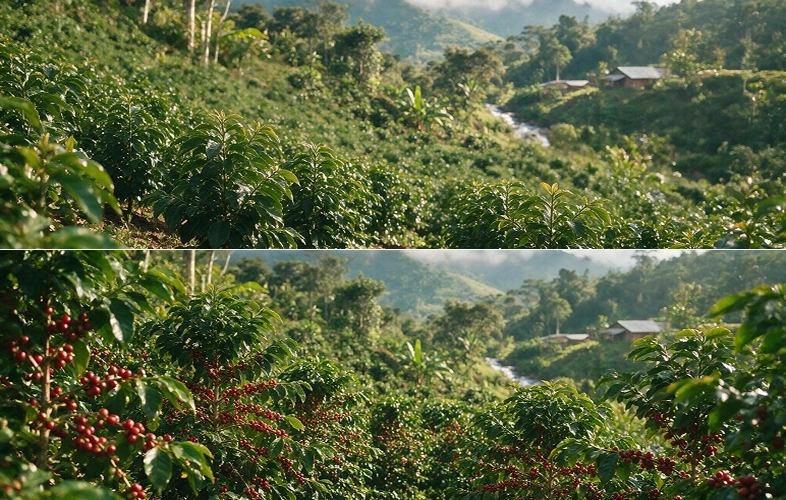

Plot-level. Native weather and climate data are downscaled to plot level using terrain and elevation correction and ML-based downscaling.
Detect early, monitor continuously, and forecast future climate-driven risks affecting crop yields, production quality, and commodity supply. A fully configurable alerting system surfaces the signals that matter to your operations.
Every provider draws on the same handful of global weather models and the same public data. The forecast is not the differentiator. Turning it into the right instruction, reaching the right person, on the right device, at the right moment is.
Full Insights Hub, all origins, all indicators
Their origin, their indicators, their suppliers
Their area of responsibility only, delivered as an alert rather than a dashboard they have to log into.

Commercial forecasts cover cities. Growing areas are often hours past the last town on the map. Picterra contextualizes weather and climate data down to individual plots and connects it to supplier and sourcing information, so teams move from country and regional averages to understanding which farms, suppliers, and volumes are exposed, and why.
See exactly where climate risk sits and what it means for your supply chain. Trace every signal to its origin, understand it in crop and supply-chain context, compare exposure across geographies, and move beyond broad averages and Tier 1 visibility.
We work from whatever geography you have: field polygons where they exist, representative GPS coordinates for a growing area where they do not, and municipality level where that is the right unit.
Turn complex climate data into answers your teams can use. Ask about suppliers, origins, risks, and forecasts in plain language, then get answers and generate reports without having to build the analysis yourself.
Typically three to six weeks. That covers configuring your origins, selecting the indicators your teams use, setting alert thresholds by crop and region, and agreeing on how alerts reach the field. Most teams start with a handful of locations in one or two origins, prove it with the field teams who will use it, then expand origin by origin.
Yes. That is what the alerting layer is for. Agronomy technicians are notified about their own area of responsibility without opening the hub at all. Supervisors see their origin, and central teams see everything.
Effectively unlimited. Access is organized by cluster, country, or region, so each team sees only what is relevant to them, and adding people does not mean adding coverage.
Yes. Field polygons where you have them, representative coordinates for a growing area where you do not, and municipality level where that is the right unit. Many growing regions have no meaningful commercial forecast at all, and a representative coordinate is enough to change that.
No. Everything is delivered from model and satellite data, so there is no hardware to install, power, maintain, or replace. Where local weather stations already exist and their data is available, we can integrate them as an additional layer.
Indicators are configured per crop and per variety, so coverage follows your supply base rather than a fixed list. The same origin can carry different thresholds for different varieties.
An API returns parameters to your developers. You still have to decide which thresholds matter, build the risk logic, connect it to your supply base, and get the result to the person in the field. That work is the product here.