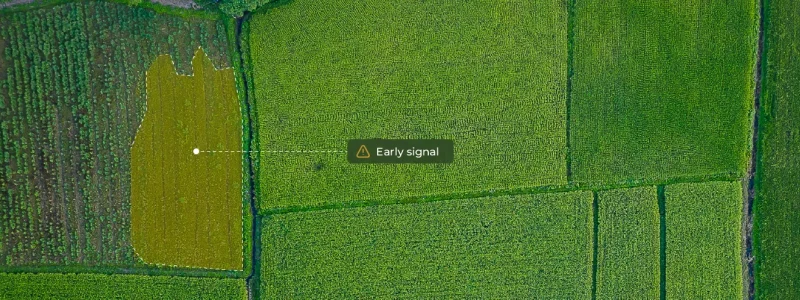
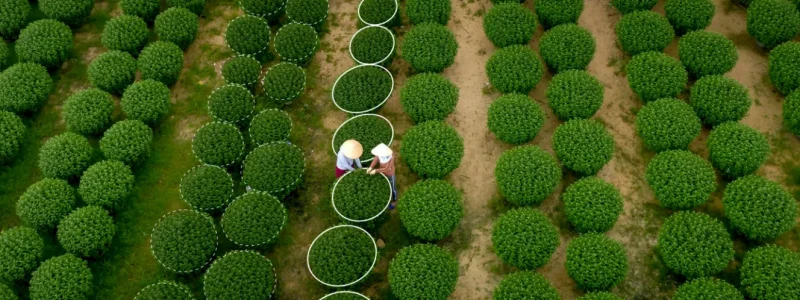
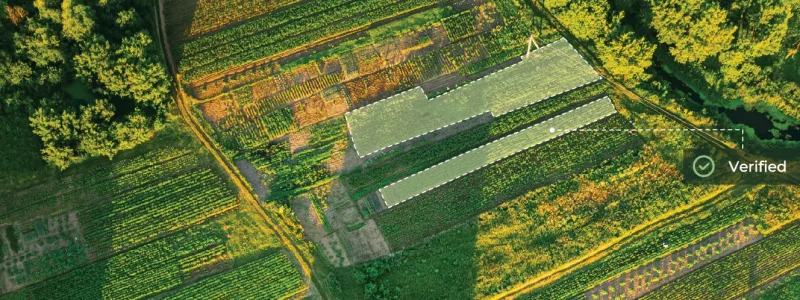
Turn regenerative agriculture commitments into continuous, plot-level evidence. Monitor where practices are implemented, how they change over time, and where intervention is needed across thousands of farms.
Regenerative agriculture programs increasingly span thousands of farms, multiple suppliers, and different production systems. But understanding what is actually happening on the ground still relies heavily on farmer declarations, periodic surveys, and sampled field visits.
That creates a fundamental visibility gap. Teams may know which practices they want farmers to adopt, but not consistently where they are present, whether they are being maintained, or how they are changing over time.
Different practices also leave different signals. Tree cover and vegetated buffers are persistent features. Cover crops and tillage appear seasonally. Crop rotations only become visible through a multi-year history. No single snapshot can capture them all.
As a result, sustainability and sourcing teams are left asking:
Insights Hub turns satellite observations and geospatial data into consistent evidence of regenerative practices across the supply base — from persistent tree and landscape features to seasonal management practices and multi-year cropping patterns.

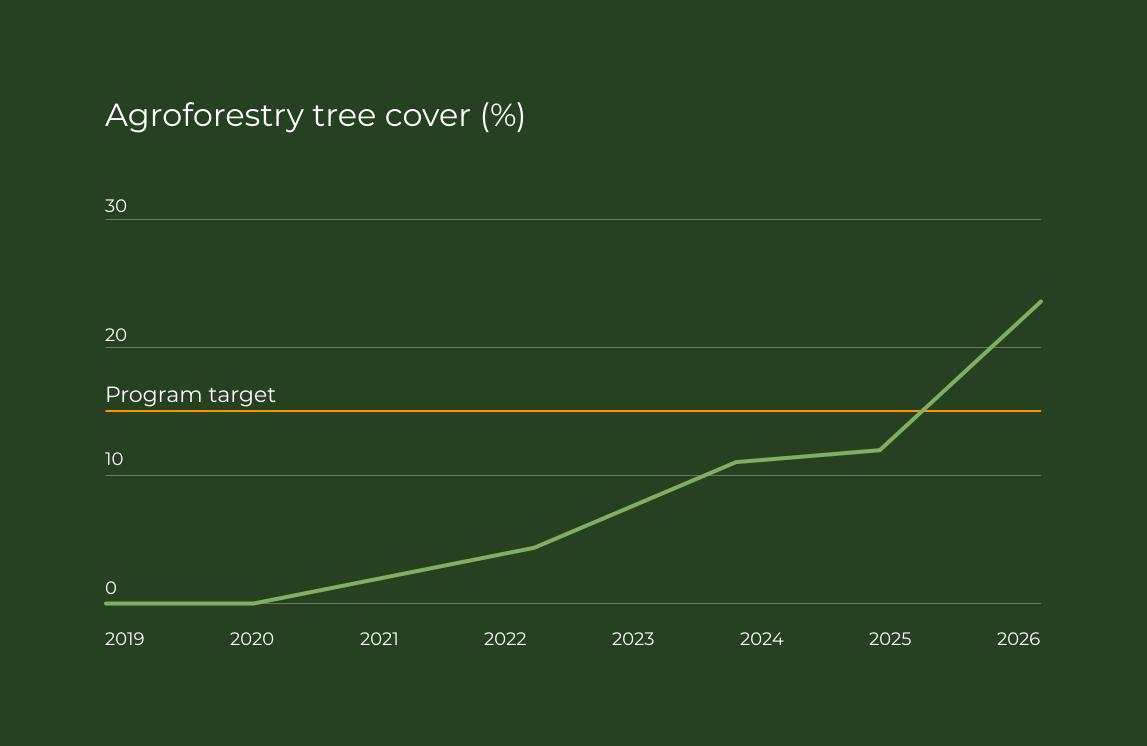

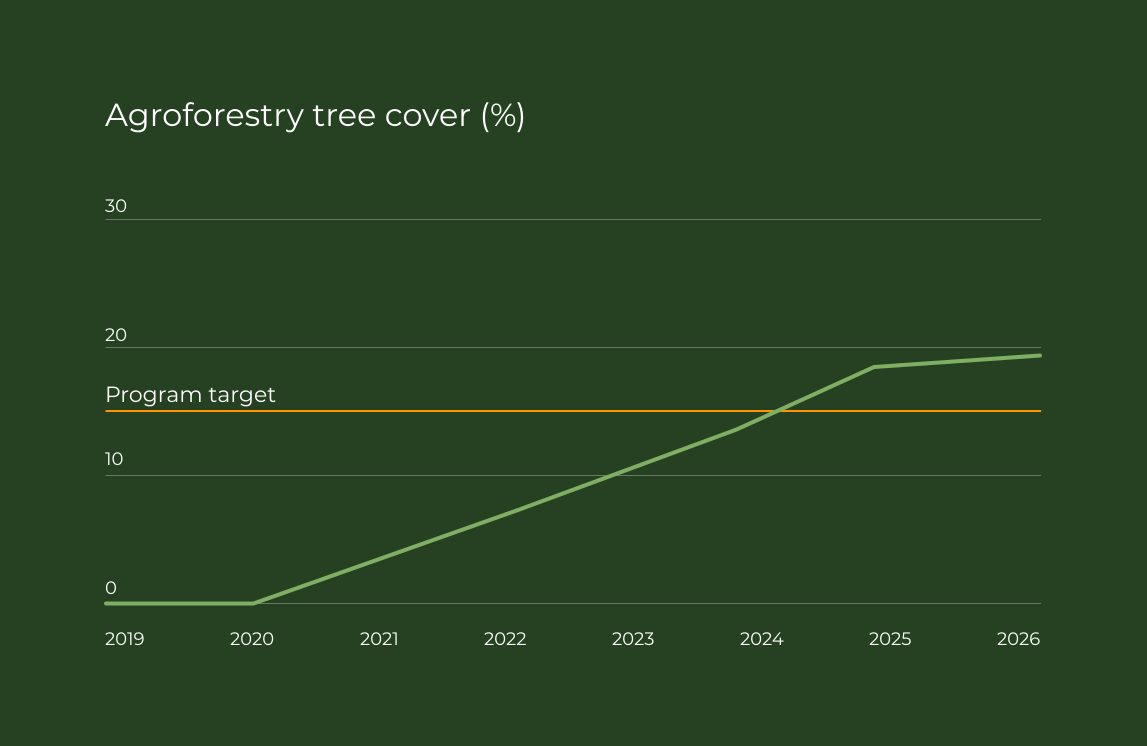
Monitor the structure, establishment and persistence of perennial vegetation:
Observe management practices changing within and between growing seasons.
Build a historical record of what happened on each plot — not just what is visible today.
Verify whether regenerative production protects the ecosystems around the farm.

Different practices require different evidence. Insights Hub combines satellite time series, GeoAI, land-cover and environmental datasets to interpret the signals relevant to each practice — from tree height and canopy structure to vegetation cover, exposed soil, waterways and multi-year crop history.
Validate supplier geolocation and plot boundaries before analysis to create a consistent spatial foundation for practice monitoring across suppliers, regions, and seasons.
Different practices leave different spatial and temporal signatures. Picterra applies the appropriate combination of canopy, vegetation, soil, land-cover, and contextual signals rather than forcing every practice through a single detection method.
Crop identification and historical crop context help interpret what satellite observations mean for a particular production system — creating a stronger foundation for practice verification, rotation analysis and change detection.
Combine current observations with satellite time series to establish baselines, identify when practices or transitions first appeared, and monitor whether they persist over time.

From custom detector prototypes to optimized workflows and enterprise integrations, our geospatial and AI experts help your team turn imagery into impact.
Remote monitoring, reporting, and verification (MRV) makes it possible to assess regenerative agriculture practices across large supply bases without relying solely on farmer declarations or sampled field visits. Picterra combines satellite imagery, geospatial data, and GeoAI to detect and track observable practices at plot level — providing consistent evidence of where practices are implemented, how they change over time, and where further verification or intervention may be needed.
Different regenerative practices leave different spatial and temporal signals. Picterra uses satellite imagery and GeoAI to interpret these signals — from tree height and canopy structure for agroforestry to vegetation and exposed-soil patterns for seasonal practices, and multi-year satellite time series for crop history and renovation. Combined with plot boundaries, crop information, and environmental datasets, these signals turn satellite observations into practice-level evidence that can be monitored across entire agricultural supply chains.
Picterra can monitor practices and landscape features across several categories, including agroforestry and shade trees, hedgerows and boundary vegetation, cover crops, tillage or low/no-till, crop rotation, crop identification, planting and harvest timing, renovation and replanting, and riparian buffers. The specific methodology depends on the crop, geography, practice, and available data.
Yes. Picterra analyzes regenerative agriculture indicators at the individual plot level and connects them with supplier and portfolio-level views in Insights Hub. This allows teams to identify where practices are present, compare performance across a supply base, and drill down from aggregated results to individual production plots.
Yes. Picterra combines current observations with historical satellite time series to establish baselines, detect changes, and track whether practices persist over time. This makes it possible to move beyond a one-time assessment and build a historical record of practices such as agroforestry, crop rotation, and renovation or replanting.
Continuous monitoring creates a consistent evidence base showing where regenerative practices are present and how they change over time. This can support internal sustainability targets, supplier engagement, certification programs, and sustainability reporting, while providing more consistent evidence across the supply base than declarations or sampled observations alone.
Picterra enables companies to monitor regenerative practices across large numbers of farms without inspecting every plot in person. Insights Hub brings practice-level evidence into a single view across plots, suppliers, and regions, helping teams identify adoption gaps, prioritize interventions, and track progress across their regenerative agriculture programs.