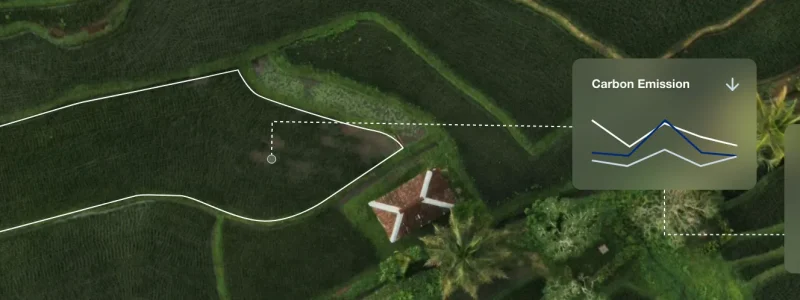
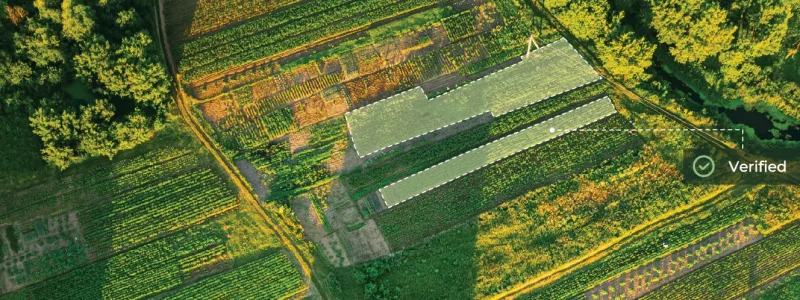
Support credible Scope 3 reporting with continuous, plot-level intelligence for land-use change emissions, carbon removals, and regenerative agriculture.
For many food and beverage companies, agricultural Scope 3 emissions represent the largest, and least visible, share of their carbon footprint. Carbon reporting often relies on regional averages, one-off field campaigns, or self-reported farm data that can’t be consistently verified or scaled across thousands of suppliers. Regional emission factors can differ from actual on-farm conditions by an order of magnitude, and they can’t capture a specific deforestation event or a change in farming practice on a specific plot, so disconnected tools and datasets risk accounting for emissions that never occurred.
As a result, sustainability and sourcing teams are left asking:

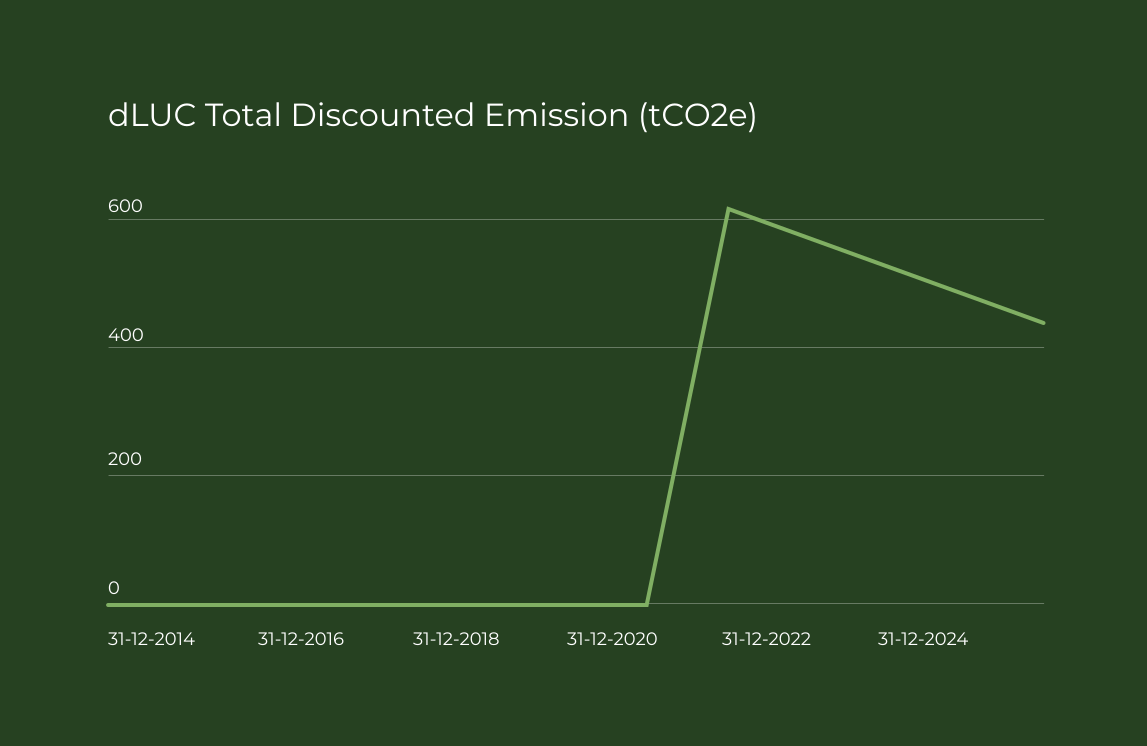
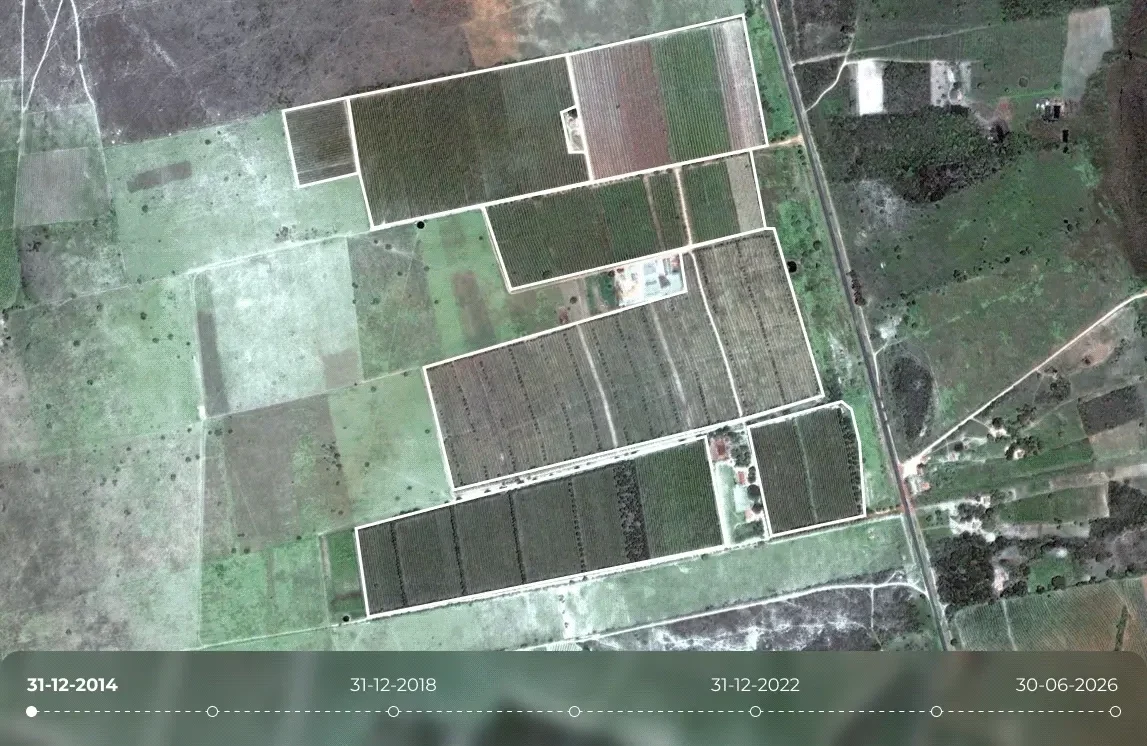
Quantify emissions resulting from deforestation, forest degradation, and ecosystem conversion using continuous plot-level monitoring, broken down by carbon pool: above-ground biomass, below-ground biomass, dead organic matter, and soil organic carbon.
Combine recognized emissions databases like Ecoinvent with your own farm management data to complete the carbon picture.
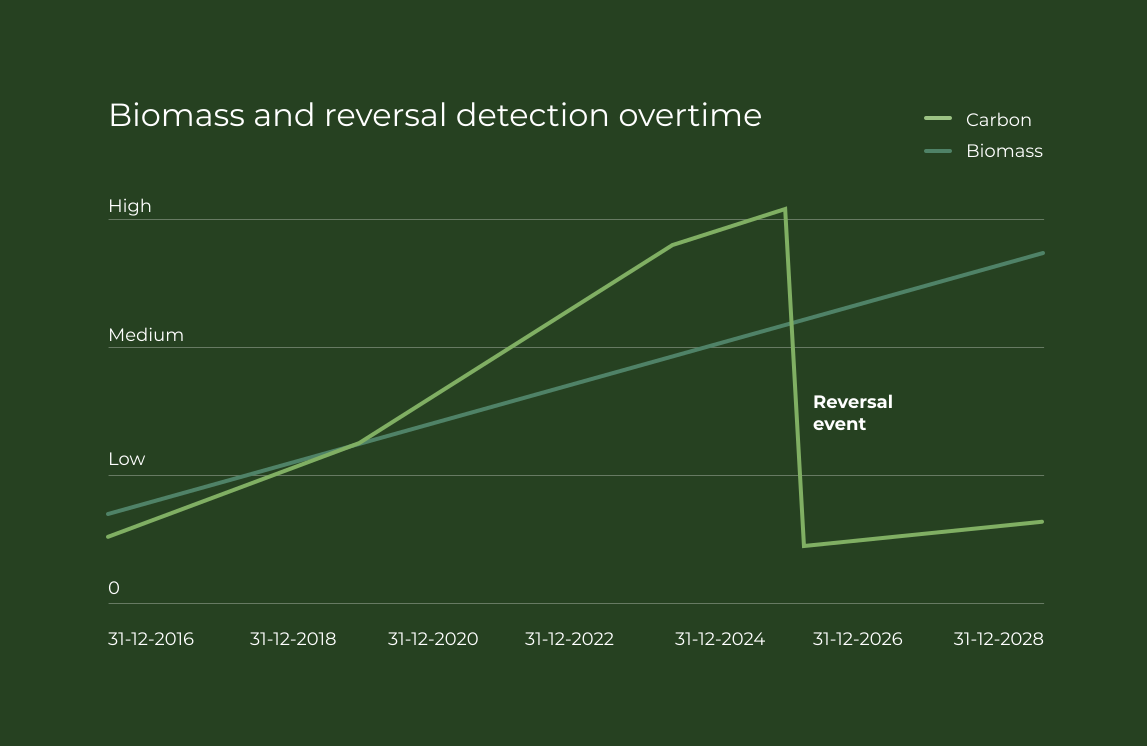

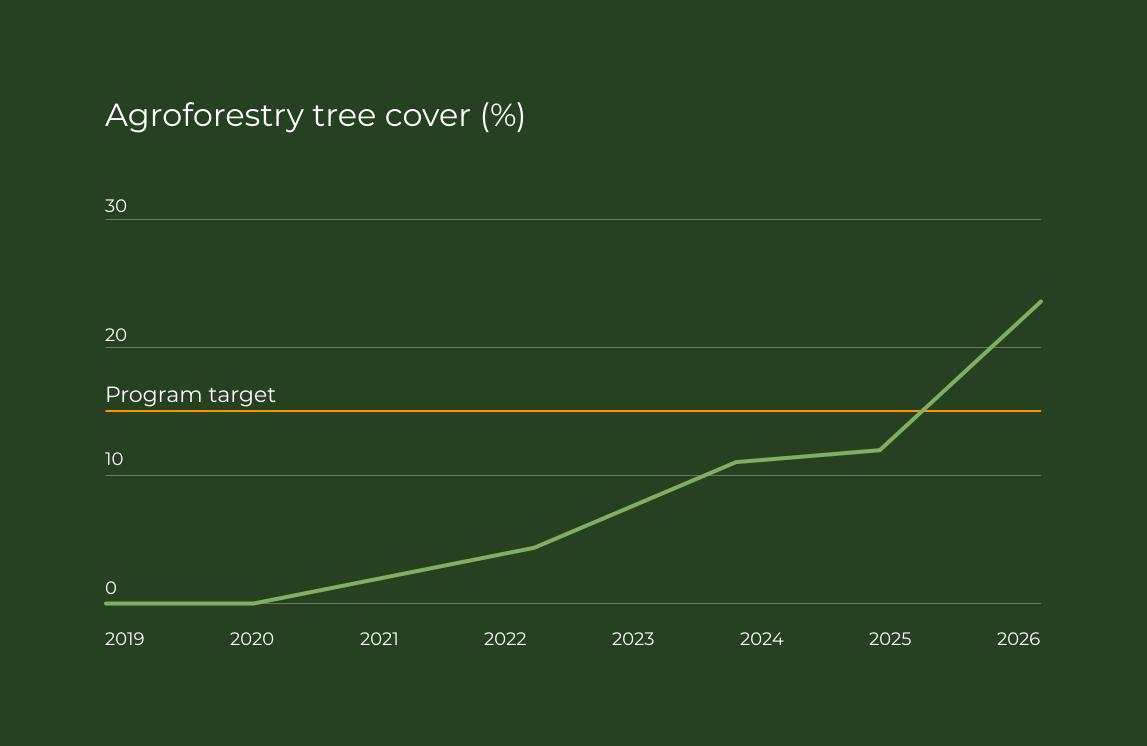
Track carbon sequestration from agroforestry, reforestation, and regenerative agriculture by verifying biomass growth, tree cover, and ecosystem recovery over time. Rather than only modeling expected outcomes, Insights Hub continuously verifies how carbon stocks actually change, providing evidence of growth, stagnation, or reversal.

GHG Protocol Land Sector and Removals Guidance, SBTi FLAG, and WCF/Quantis provide the accounting principles.
Ecoinvent, regional soil datasets, and other authoritative sources provide emissions and carbon factors.
Satellite imagery continuously measures what is happening on every plot.
Combines all inputs into one continuous, plot-level carbon intelligence workflow.

From custom detector prototypes to optimized workflows and enterprise integrations, our geospatial and AI experts help your team turn imagery into impact.
Carbon intelligence is the continuous measurement, monitoring, and verification of land-based carbon across agricultural supply chains. Picterra Insights Hub combines satellite observations, plot-level monitoring, and geospatial AI to help organizations quantify land-use change emissions, monitor carbon removals, and support credible Scope 3 reporting across thousands of suppliers.
Traditional carbon accounting often relies on regional averages, field sampling, or self-reported farm data. Continuous plot-level monitoring provides a more representative picture of what's happening on the land by observing every plot throughout the year. This helps organizations strengthen Scope 3 reporting, verify carbon removals, monitor regenerative agriculture, and identify land-use change at scale.
Picterra's carbon intelligence is built on widely recognized carbon accounting methodologies and continuously enhanced through plot-level geospatial monitoring. For direct land-use change (dLUC) emissions, our methodology is benchmarked against the World Cocoa Foundation (WCF) and Quantis GHG Accounting Manual for Cocoa (Option B) and aligned with the principles of the GHG Protocol Land Sector and Removals Guidance (GHGP-LSRG), enhanced with regional soil organic carbon datasets. This enables organizations to measure emissions and carbon removals using transparent, scalable, and evidence-based workflows.
Picterra monitors carbon removals by tracking changes in above-ground carbon stocks over time using satellite observations. Rather than relying solely on periodic field measurements, Insights Hub continuously monitors biomass growth, agroforestry establishment, reforestation, and ecosystem recovery across every plot. This enables organizations to verify carbon gains, identify reversals, and monitor project performance throughout the life of a program.
Carbon intelligence requires more than satellite imagery alone. Insights Hub combines continuous Earth observation with trusted carbon datasets, regional reference layers, and customer data to create a unified view of emissions, removals, biomass, soils, and ecosystem change. Bringing these datasets together in one platform provides consistent, plot-level insights while reducing the complexity of managing multiple tools and methodologies separately.
A regional or jurisdictional emission factor charges every supplier in that area the same rate, whether they cleared forest last year or have farmed the same plot for decades. That average can't identify a specific deforestation event, differentiate between suppliers, or reward good practice. Plot-level direct land-use change accounting gives organizations evidence they can act on, and aligns with where reporting frameworks like the GHG Protocol and SBTi FLAG, and regulations like EUDR, are converging.
No. Picterra provides the plot-level quantification and evidence that feeds voluntary and internal carbon reporting. Formal credit issuance and certification, for example through registries such as Verra, is a separate process carried out by accredited certifiers. Picterra supplies the spatial data and methodology that make those conversations credible.