
From location points to polygons, ensure farm plot data integrity. Automate validation, eliminate errors, and meet regulatory standards with confidence.
Accurate and traceable farm plot location data is essential for ensuring supply chain transparency, monitoring sustainability performance, and reducing environmental risks in agriculture. As stakeholder expectations rise, these capabilities have also become a regulatory requirement under frameworks such as the EU Deforestation Regulation (EUDR). Plot data can typically be collected either as polygons—representing precise mapped boundaries—or as points indicating general location coordinates. Picterra’s advanced geoAI technology provides powerful tools to verify the quality of this data, helping you maintain high integrity and meet the highest standards. With Picterra Tracer, you can automate the detection and correction of common data issues, and generate detailed reports and visualizations to support both compliance and ongoing monitoring.
Our platform automates detecting and correcting common errors, such as misplaced points due to projection issues or manual entry mistakes.

Incorrectly placed points due to projection errors

Incorrectly placed points due to projection errors
Polygon data often presents challenges, such as self-intersecting boundaries, incorrect placements, or missing geographic information. Picterra’s tools simplify the process of detecting and correcting these issues.

Correction of self-intersections and outliers in a dataset of polygons

Verification of unusual size of polygons

Verification of unusual size of polygons

Line instead of a polygon
Verification of unusual size of polygons
Line instead of a polygon

Correction by splitting the polygons with holes to multi-polygons

Correction of wrong vertices with inner and/or outer loops
Managing supplier data involves collecting, verifying, and unifying data from various formats, which can be complex. Picterra Tracer simplifies this by ensuring data from different suppliers, whether in CSV, KML, or other formats, is readable and GIS-ready. Our system consolidates files into a unified database, performs rigorous quality checks, and corrects common data errors. This process includes handling typos, inverted data points, mismatched points, and polygons and maintaining high data integrity through automated workflows.
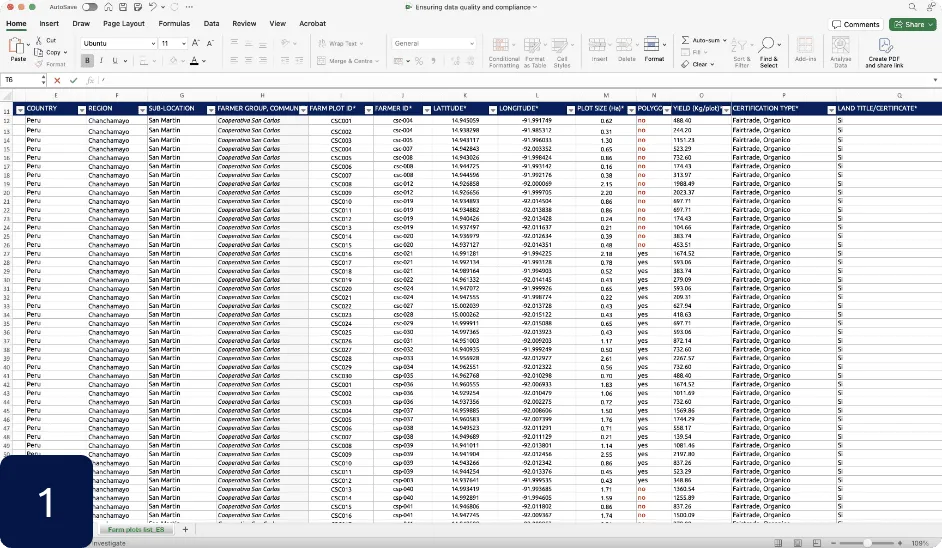
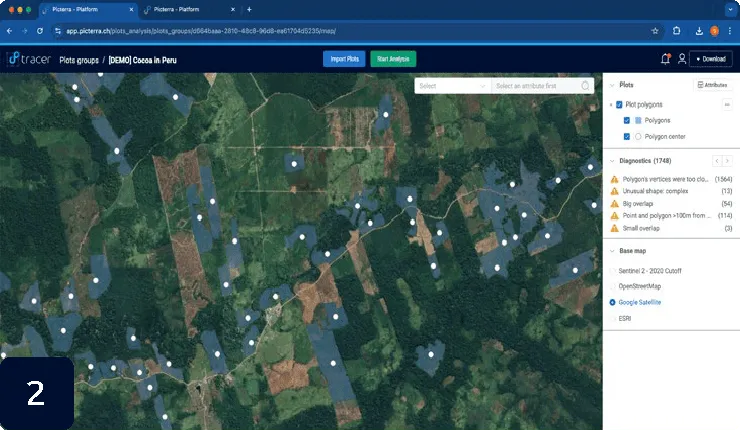
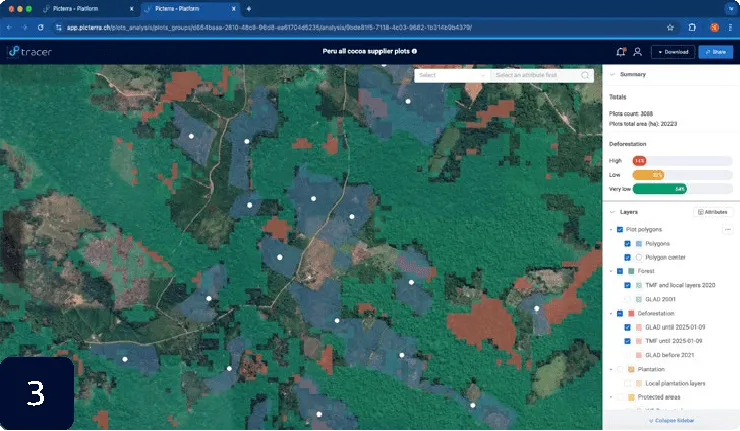
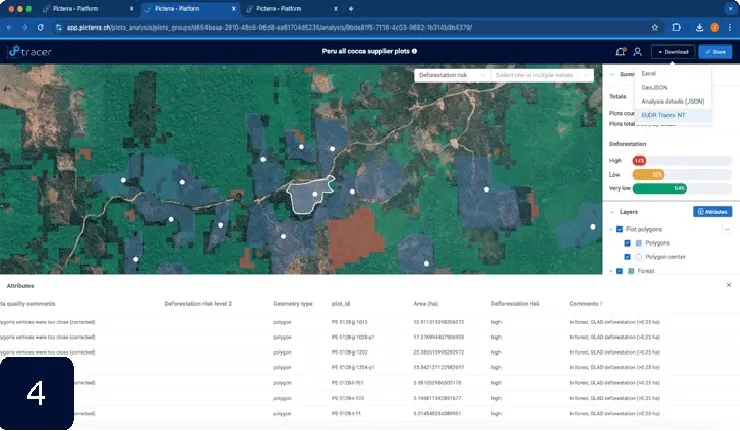
We use AI-powered data extraction to fill gaps when supplier data is incomplete. As a result, we provide a quality-verified, aggregated database of farm plots accessible on the Picterra Tracer. This includes detailed plot maps, visualizations, and statistics per supplier, region, and time, ensuring a single source of truth and aiding in comprehensive compliance and accountability.

Picterra comprehensively assesses your dataset’s quality, ensuring all data points and polygons are accurate and complete. Our solution offers detailed reporting on all corrections, enhancing transparency and reliability. Features like automatic detection of duplicate geometries and ensuring projection consistency are part of our holistic approach to data quality.

Meet the EU Deforestation Regulation requirements with accurate farm plots data.


Geospatial data quality refers to the accuracy, completeness and consistency of location and boundary data associated with farms and production plots. Poor-quality data — from incorrect coordinates to invalid or overlapping farm boundaries — can undermine supply chain traceability, sustainability monitoring and compliance assessments. Picterra helps organizations validate and standardize this data before it is used for analysis and reporting.
The EU Deforestation Regulation (EUDR) requires companies to provide geolocation information for plots where relevant commodities were produced. Inaccurate coordinates, invalid polygons or incomplete plot data can therefore create problems during risk assessment and due diligence. Validating farm geolocation data helps organizations build a more reliable foundation for EUDR compliance and deforestation monitoring.
Picterra automatically runs more than 30 data quality checks across incoming farm and supplier records. These tests identify issues such as incorrect coordinates, invalid geometries, duplicate or overlapping plots, unusual plot sizes and other spatial inconsistencies. Records can then be categorized by risk, helping teams identify which data requires attention before further analysis.
Picterra detects common errors in both point and polygon data. For coordinates, this can include inverted latitude and longitude, manual entry errors, projection issues or locations falling in invalid areas such as water. For farm boundaries, Picterra can identify issues such as self-intersections, incorrect geometry types, duplicate or overlapping plots, holes and unusual geometries. Where possible, these issues can be automatically corrected and standardized for further geospatial analysis.
Picterra can ingest farm and supplier data from common formats including spreadsheets such as CSV and XLS, as well as geospatial files including KML, Shapefiles and GeoJSON. Data can then be verified, corrected and converted into GIS-readable formats for consistent analysis.
Yes. Picterra can bring fragmented farm and supplier datasets from multiple sources into a unified geospatial database. Records are standardized and quality-checked before analysis, giving teams a consistent view of plots across suppliers, regions and sourcing programs. This creates a reliable data foundation for traceability, compliance and sustainability monitoring.